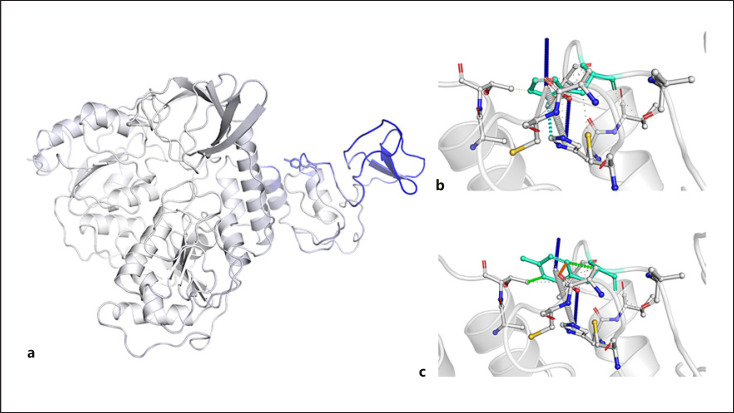
Fig. 3.
a Model of helicase protein displaying the amino acids colored according to the vibrational entropy change upon mutation (a). Red regions are those gaining flexibility, whereas blue regions are those gaining stability; the top image shows the molecular interaction between the side chain of the wild-type amino acid and the side chains of the surrounding amino acid (b); the bottom image shows the molecular interaction between the side chain of the mutated amino acid and the side chains of the surrounding amino acid (c).

