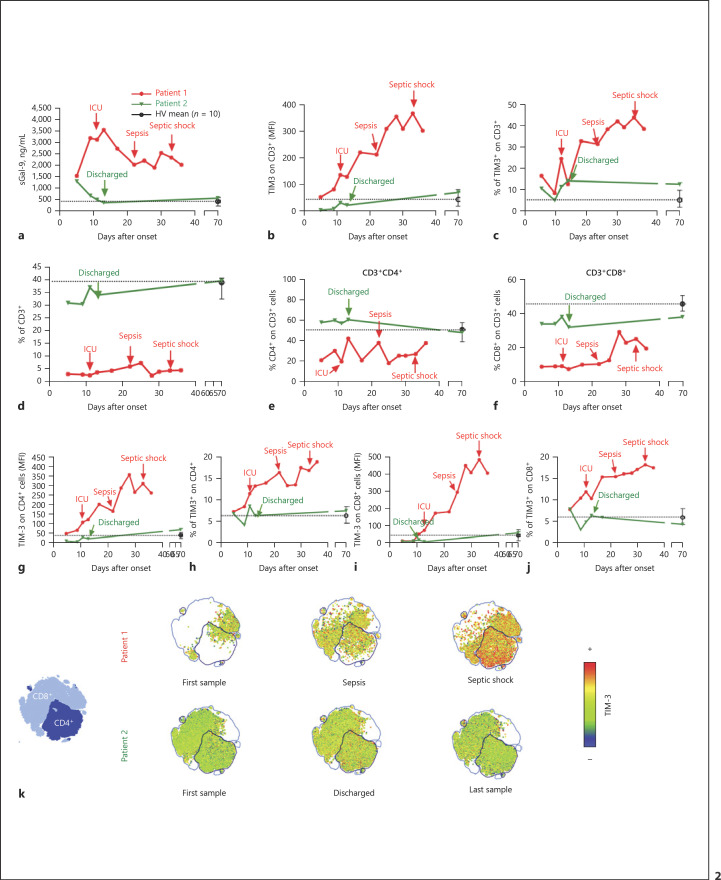
Fig. 2.
Gal-9/TIM-3 axis showing disparate levels and patterns for patients 1 and 2. a The plasma levels of soluble Gal-9 (sGal-9) from patients 1 and 2, collected until exitus or discharge, respectively, and the mean levels for 10 healthy volunteers (HVs) with negative SARS-CoV-2 RT-PCR results are shown. b A final reading from patient 2, obtained 70 days after disease onset, is also shown. The mean fluorescence intensities (MFI) of TIM-3 on gated CD3+ cells are shown. c Percentage of TIM-3+ cells on gated CD3+ cells. d The percentages of CD3+ cells from total leukocytes are shown. e, f The percentages of CD4+ (e) and CD8+ (f) cells on CD3+ cells are shown. g, h The MFI of TIM-3 (g) and the percentage of TIM-3+ cells (h) on gated CD4+ cells are shown. i, j The MFI of TIM-3 (i) and the percentage of TIM-3+ cells (j) on gated CD8+ cells are shown. k The t-SNE map clustering expression of TIM-3 on CD4+ and CD8+ populations is shown. a–j Data from patient 1 are shown in red, and data from patient 2 are shown in green. Dashed lines represent the calculated means from the analysis of a single sample from 10 HVs (mean ± SD). Arrows indicate important clinical events (patient 1: ICU admission, sepsis, and septic shock; patient 2: discharge).

