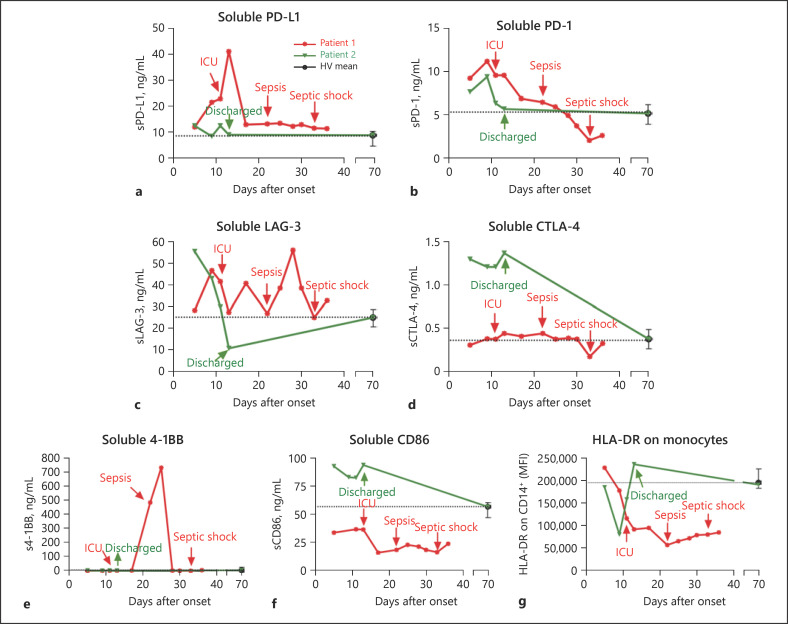
Fig. 3.
Soluble plasma levels of immune checkpoints from patients 1 and 2. a–f The plasma levels of soluble immune checkpoints from patients 1 and 2, collected until exitus or discharge, respectively, and the calculated means from the analysis of a single sample from 10 healthy volunteers (HV) with negative SARS-CoV-2 RT-PCR results. A final reading from patient 2, obtained 70 days after disease onset, is also shown. Soluble levels of PD-L1 (a), PD-1 (b), LAG-3 (c), CTLA-4 (d), 4-1BB (e), and CD86 (f) are shown in the respective panels. g The mean fluorescence intensities (MFI) of HLA-DR on gated CD14+ monocytes are shown. a–g Data from patient 1 are shown in red, and data from patient 2 are shown in green. Dashed lines represent the calculated means from the analysis of a single sample from 10 HVs (mean ± SD). Arrows indicate important clinical events (patient 1: ICU admission, sepsis, and septic shock; patient 2: discharge).

