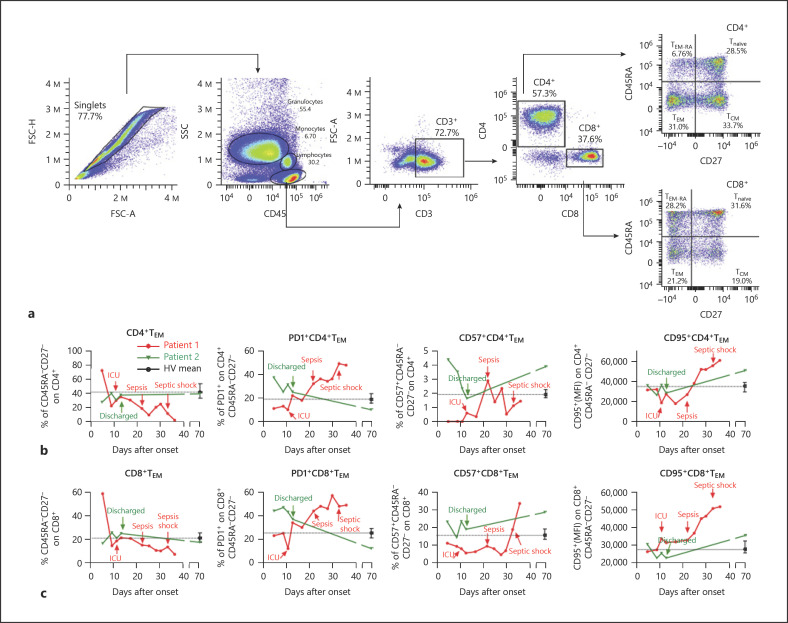
Fig. 4.
Effector memory T-cell analysis. a Gating strategy (TEM, effector memory T cells; TCM, central memory T cells; TEM-RA, terminally differentiated T cells; Tnaïve, naïve T cells). b, c The analyses of TEM on both gated CD4+ (b) and CD8+ (c) cells are shown. Left panels: the percentages of TEM are shown. Central left panels: the mean fluorescence intensities (MFI) of PD-1 on gated CD4+ and CD8+ TEM are shown. Central right panels: the percentages of CD57+ cells on gated CD4+ and CD8+ TEM are shown. Right panels: the MFI of CD95 on gated CD4+ and CD8+ TEM are shown. b, c Note that data from patient 1 are shown in red, while the data from patient 2 are shown in green. The dashed lines represent the calculated means from the analysis of a single sample from 10 healthy volunteers (HVs) (mean ± SD). Arrows indicate important clinical events (patient 1: ICU admission, sepsis, and septic shock; patient 2: discharge).

