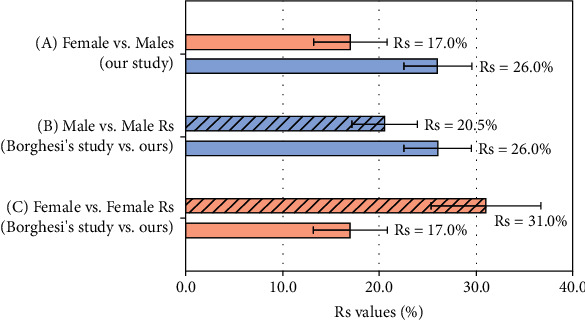
Figure 3.

Comparison of Rs from CXR severity and age between groups. (a) Grouped bar graphs between males and females in our study (Rs = 0.260 and Rs = 0.170, respectively). (b) Comparison between males (from Borghesi's study, Rs = 0.205) vs. males (our patients, Rs = 0.260). (c) Females (from Borghesi's study, Rs = 0.310) vs. females (our patients, Rs = 0.170). The 95% confidence intervals of the bars for the Rs per cent of the females vs. females comparison did not overlap. Therefore, the percentages were significantly different, as described by their p value in Results.
