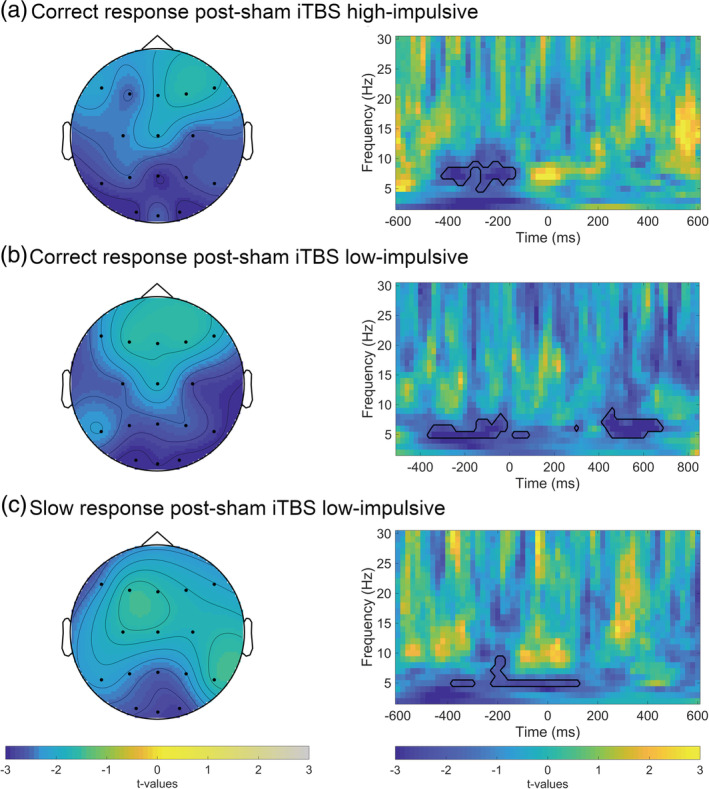
FIGURE 3.

Response‐locked time‐frequency averages of brain‐behavior relations between theta (4–7.5 Hz) ITPC and flanker task reaction times in Go trials. The panel on the right depicts t‐values for full time‐frequency (1–30 Hz) averaged over parieto‐occipital electrodes. Black lines highlight clusters in the data smaller than the prespecified threshold (α <.025); t = 0 corresponds to the response. (a) Slow responses to Go stimuli after verum stimulation in the high‐impulsive group. Left side: t‐values for theta ITPC‐RT relations averaged between 480 and 160 ms preresponse. (b) Correct responses after sham stimulation in the low‐impulsive group. Left side: t‐values for theta ITPC‐RT relations averaged between 500 ms pre‐ and 280 ms postresponse. (c) Slow responses to Go stimuli after sham stimulation in the low‐impulsive group. Left side: t‐values theta ITPC‐RT relations averaged between 500 ms pre‐ and 140 ms postresponse
