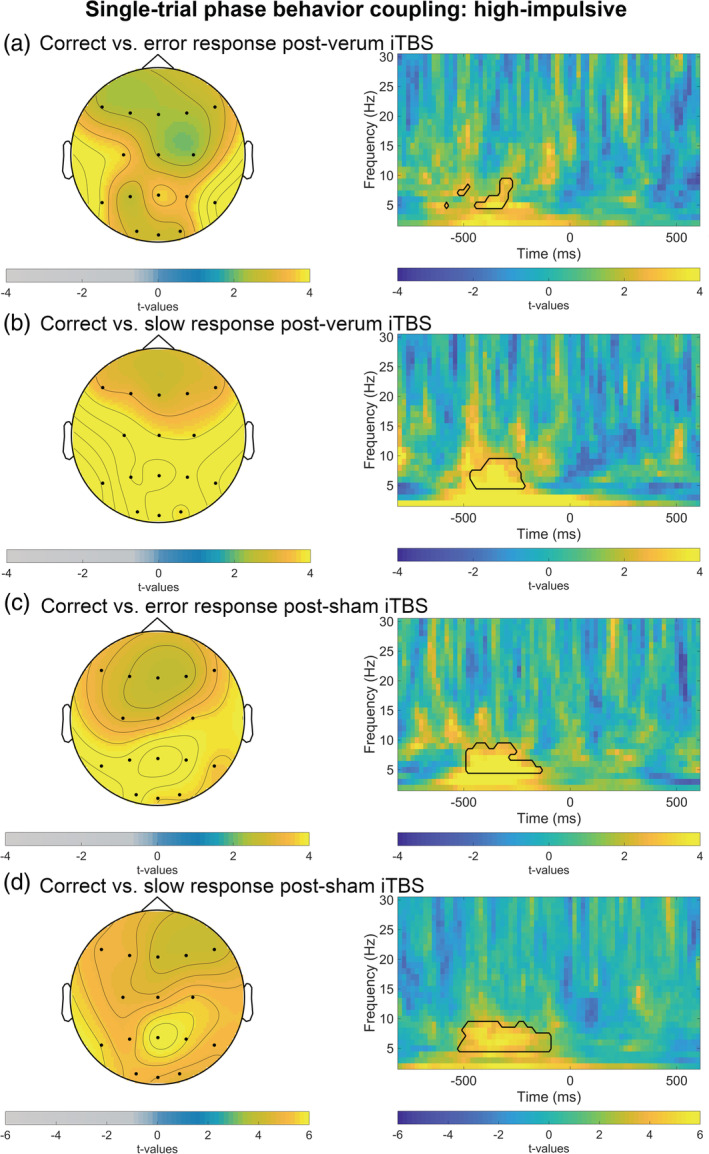
FIGURE 5.

Averages of trial‐to‐trial brain‐behavior relations in high‐impulsive subjects: theta (4–7.5 Hz) ITPC weighted by flanker task reaction time (RT) in Go trials. The panel on the right depicts t‐values for full time‐frequency (1–30 Hz) from (c) parieto‐occipital and (a,b,d) frontal and parieto‐occipital electrodes. Black lines highlight clusters in the data smaller than the prespecified threshold (α <.025). t = 0 corresponds to the response. For visual clearness scales are optimized for each condition. (a) Left side: t‐values for theta wITPC in correct versus error trials after verum stimulation averaged between 500 and 80 ms preresponse. (b) Left side: t‐values for theta wITPC correct versus slow trials after verum stimulation averaged between 500 and 20 ms preresponse. (c) Left side: t‐values for theta wITPC in correct versus error trials after sham stimulation averaged between 500 and 0 ms preresponse. (d) Left side: t‐values for theta wITPC correct versus slow trials after sham stimulation averaged between 500 and 20 ms preresponse
