FIGURE 6.

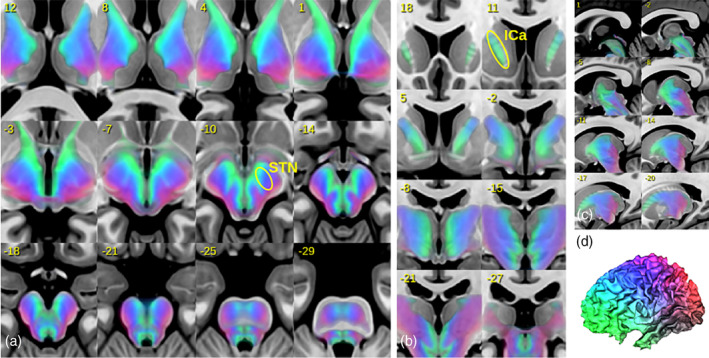
Illustration of group‐averaged SPECTRE maps in MNI space. In (a–c) axial, coronal and sagittal slices are shown. In (d) the associated cortical coding is shown. Legend: ICa, anterior limb of internal capsule; STN, subthalamic nucleus

Illustration of group‐averaged SPECTRE maps in MNI space. In (a–c) axial, coronal and sagittal slices are shown. In (d) the associated cortical coding is shown. Legend: ICa, anterior limb of internal capsule; STN, subthalamic nucleus