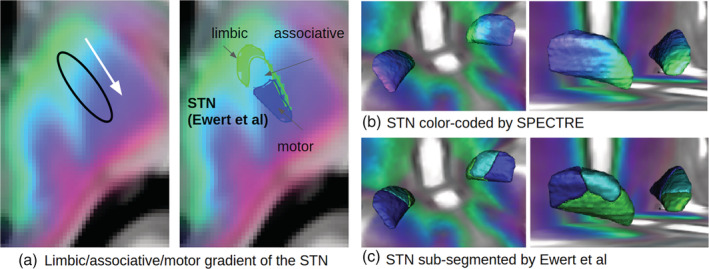
FIGURE 7.

SPECTRE maps in MNI space compared to sub‐segmentations (limbic, associative, and motor) of the STN as proposed in Ewert et al. (2018). A close‐up of a single axial slice is shown in (a). The 3D surface plots show the STN either color‐coded by SPECTRE (b) and the corresponding atlas segmentation (c)
