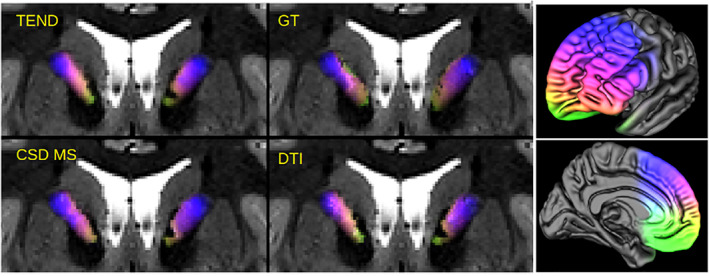
FIGURE 9.

Illustration of SPECTRE application at the ICa with a pure prefrontal coloring (right). SPECTRE maps are shown as an overlay on T2 weighted images. The different approaches (TEND,GT, CSD MS, DTI) agree quite well. The underlying data comes from the example HCP dataset
