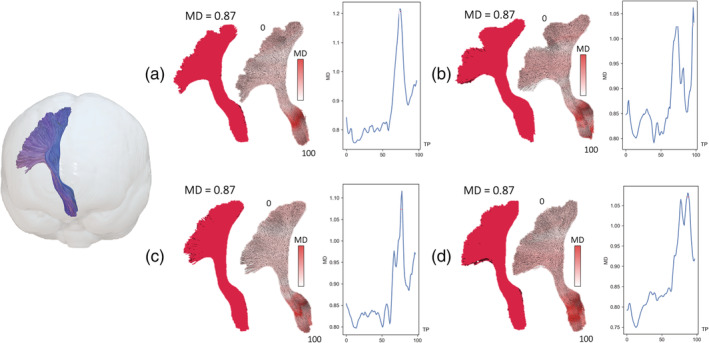
FIGURE 1.

The advantage of assessing along‐tract diffusion metrics over whole tract averaging. (a–d) The left corticospinal tract (shown on the left in a glass‐brain projection for reference) of four subjects in the present study. Averaging a diffusion metric over the entire tract yields the same mean diffusivity (MD) value (0.87 μm2/ms) for each subject (full red tract). Analysis of MD at 100 points along the length of the corticospinal tract demonstrates considerable variability in regional MD within and between tracts. TP = tract points
