
FIGURE 4.
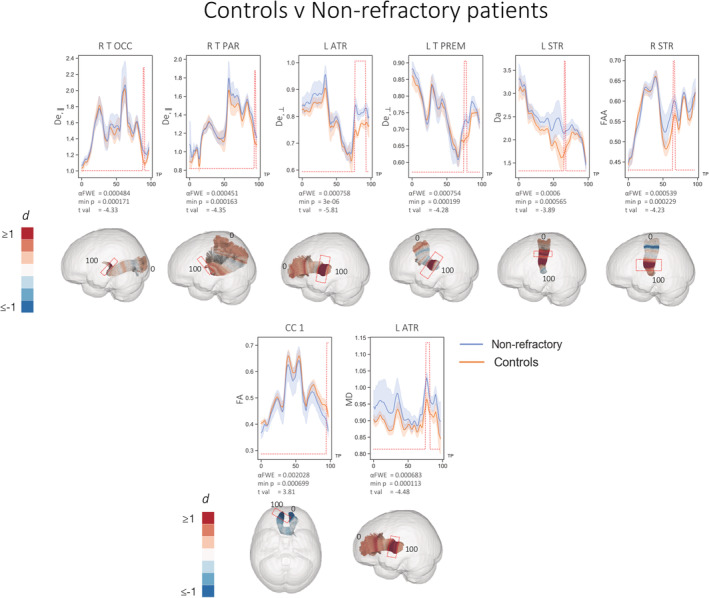
Statistically significant (red peaks) along‐tract differences in FBWM diffusion properties in nonrefractory patients relative to controls. 3D plots show Cohen's d values projected onto the relevant tracts with significant region highlighted by red boxes. Effect sizes greater than and equal to 1 are shown in dark red, with those less than and equal to −1 shown in dark blue. Diffusivities are expressed in units of μm2/ms, while ζ values are in units of ms1/2/μm; all other quantities are dimensionless. TP = tract points