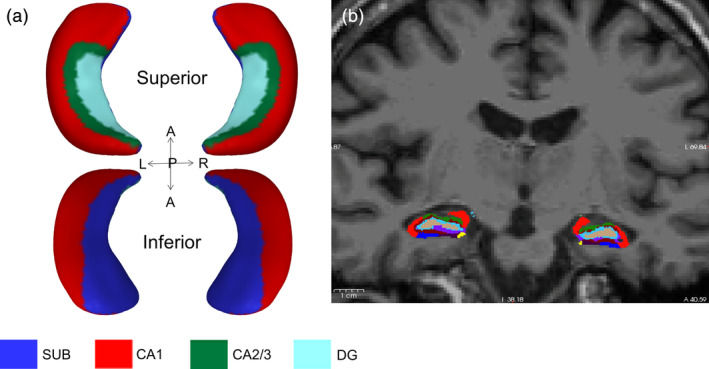
FIGURE 1.

Example of hippocampal shape analysis (a) and hippocampal subfield volumetric segmentation overlaid on a T1‐weighted image in coronal view (b). Blue denotes subiculum, red denotes CA1, green denotes CA2/3 and turquoise denotes molecular layer of the dentate gyrus. L, left; R, right; A, anterior; P, posterior
