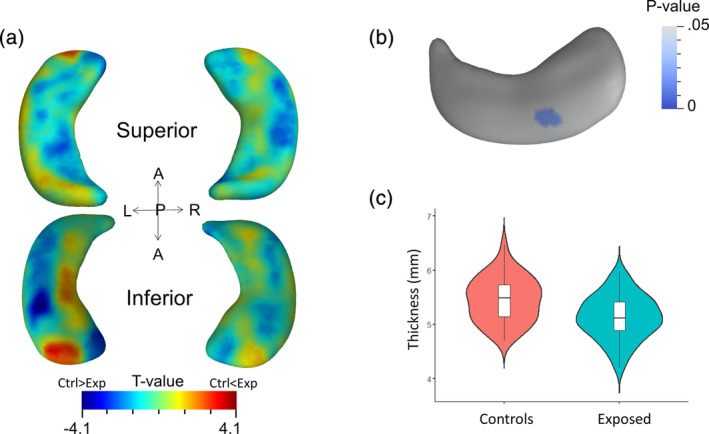
FIGURE 2.

The main effect of GDM‐exposure on hippocampal morphology. (a) Corrected t‐value map shows vertex‐wise group differences on the whole hippocampal surface between GDM exposed children and unexposed children, where warm colors denote larger thickness in GDM exposed children compared to unexposed children and cool colors denote smaller thickness in GDM exposed children compared to unexposed children. (b) Significant group differences were observed in a cluster on the inferior body of the left hippocampus. The significance levels are shown with RFT‐corrected p‐values. (C) Post‐hoc analyses of the cluster reveal significantly reduced hippocampal thickness in children with GDM‐exposure compared to unexposed children. All statistical tests used age, BMI z‐score and ICV as covariates of no interest
