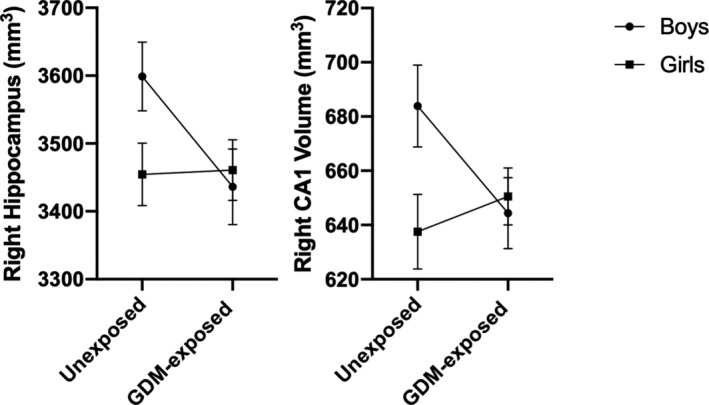
FIGURE 3.

Interaction between GDM‐exposure and sex on right hippocampal volume and CA1 hippocampal subfield volume. LSmeans (SE) adjusted for child age, ICV and BMI z‐score between unexposed and GDM‐exposed children stratified by sex (boys in circles, girls in squares)
