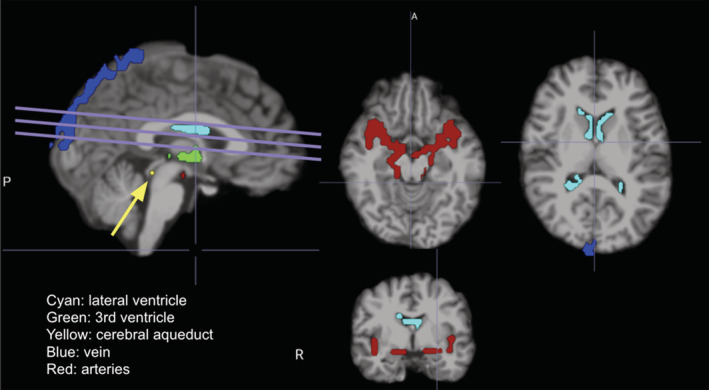
FIGURE 1.

Regions of interest, specifically CSF and vascular ROIs, for a representative subject, overlaid on the T1 anatomical. The lines indicate the fMRI slice orientation, and the arrow indicates the aqueduct. A, anterior; P, posterior; R, right

Regions of interest, specifically CSF and vascular ROIs, for a representative subject, overlaid on the T1 anatomical. The lines indicate the fMRI slice orientation, and the arrow indicates the aqueduct. A, anterior; P, posterior; R, right