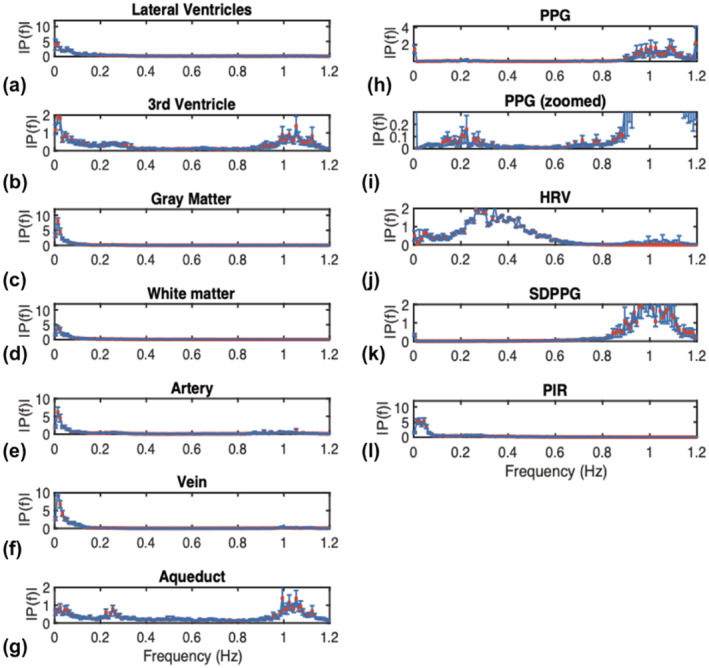
FIGURE 3.

The frequency spectrum of the fMR time series in CSF‐related ROIs, contrasting spectra from other ROIs as well as the PPG‐associated spectra. Spectra are averaged across subjects, and error bars represent SE. CSF‐related ROIs include the lateral ventricles (LV), the third ventricle (3rd V), and the cerebral aqueduct. All signals have been resampled (to the maximum frequency of the rs‐fMRI data). Notice that for the PPG spectrum, the cardiac peak is substantially higher than the low‐frequency peak
