
FIGURE 5.
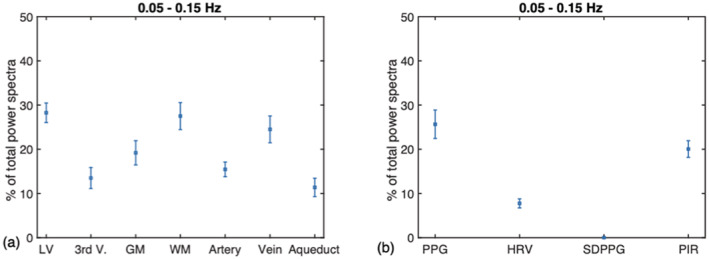
The percent signal power found in the 0.1 Hz band. These are presented as fractions of the total spectral power up to 1.2 Hz. (a) On average (across all subjects), the M‐wave frequency range contributes most to the rs‐fMRI signal in the lateral ventricles (LV), followed by the white matter (WM) and large veins. (b) Among the PPG‐derived measures, the 0.1 Hz frequency range accounts for the most power in the PPG signal, followed by the PIR signal, HRV and SDPPG. GM: gray matter; LV: lateral ventricles; 3rd V: third ventricle; WM: white matter. Error bars represent the SD across subjects