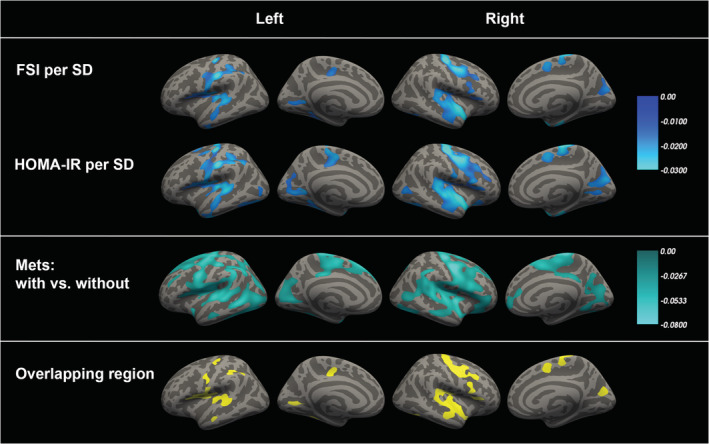
FIGURE 1.

The relation between insulin resistance, metabolic syndrome and cortical thickness. Note: Age‐ and sex‐adjusted vertex‐based whole brain analysis in 973 participants (aged 30 years and above) demonstrated an inverse association between insulin resistance as represented by fasting serum insulin (FSI) and homeostasis model assessment of insulin resistance (HOMA‐IR) as well as metabolic syndrome (MetS) and cortical thickness in several brain regions. All clusters that survived statistical significance testing after multiple comparisons correction using FDR <0.05 and were larger than 200 mm2 are illustrated. The color scales indicate the age‐ and sex‐adjusted beta values per SD increase in FSI or HOMA‐IR or between participants with and without MetS. For further details, see Table 4, 5, 6
