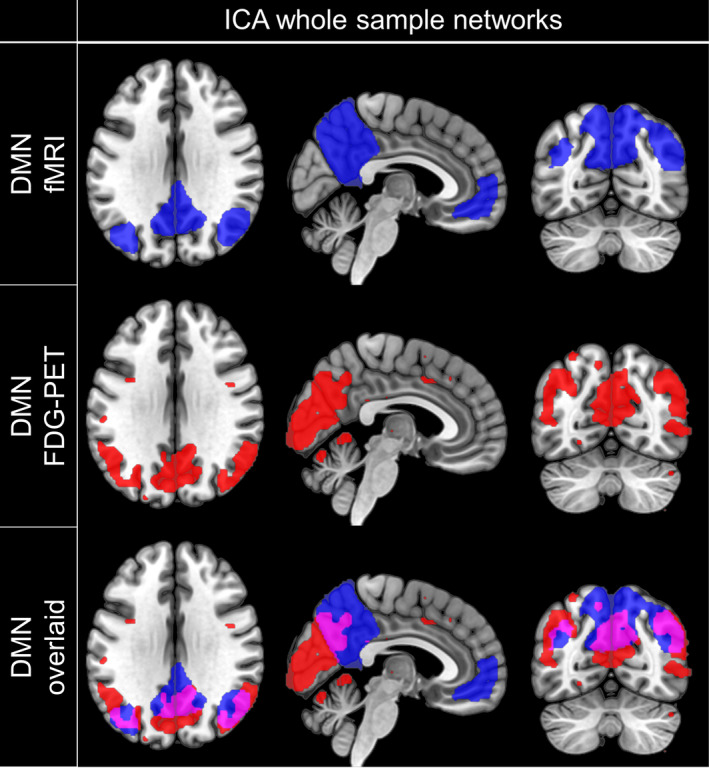
FIGURE 2.

Spatial coincidence of ICA‐derived metabolic and functional DMN. Spatial distribution of components representing the DMN obtained by fMRI (first row) or FDG‐PET (second row) and their spatial correspondence (third row). Masks were created by thresholding the component‐specific group maps at z = 2 and overlaid on a T1‐weighted MNI template for visualization. Neurological view. DMN, default mode network; ICA, independent component analysis; FDG‐PET, Fluorodeoxyglucose positron emission tomography
