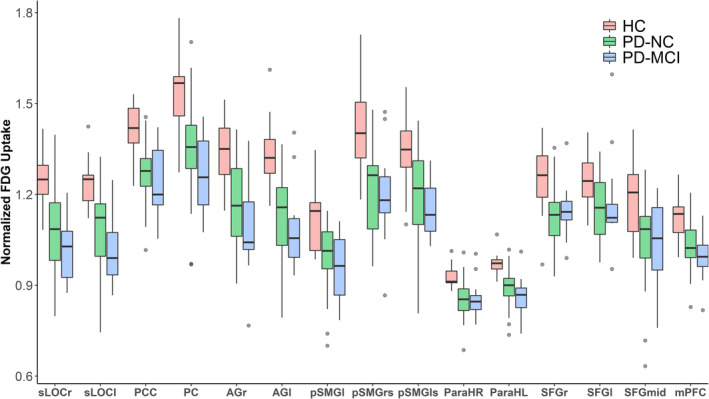
FIGURE 3.

Metabolic DMN activity in HC (n = 16), PD‐NC (n = 36), and PD patients with MCI (n = 12). In PD patients, normalized regional FDG uptake was significantly reduced in all DMN nodes when compared to healthy controls. For all ROIs, a significant trend towards a progressive metabolic deficit from healthy controls via cognitively unimpaired patients to MCI patients was observed (Jonckheere–Terpstra test p < .01). Grey colored dots indicate outliers (defined as >1.5 times the interquartile distance range). AGl, angular gyrus left; AGr, angular gyrus right; HC, healthy controls; mPFC, medial prefrontal cortex; ParaHL, parahippocampal cortex left; ParaHR, parahippocampal cortex right; PC, precuneus cortex; PCC, posterior cingulate cortex; PD‐MCI, PD patients with mild cognitive impairment; PD‐NC, PD patients with normal cognition; pSMGl, posterior supramarginal gyrus left; pSMGls, posterior supramarginal gyrus left superior; pSMGrs, posterior supramarginal gryus right superior, SFGl, superior frontal gyrus left; SFG mid, superior frontal gyrus mid; SFGr, superior frontal gyrus right; sLOCl, superior lateral occipital cortex left; sLOCr, superior lateral occipital cortex right
