
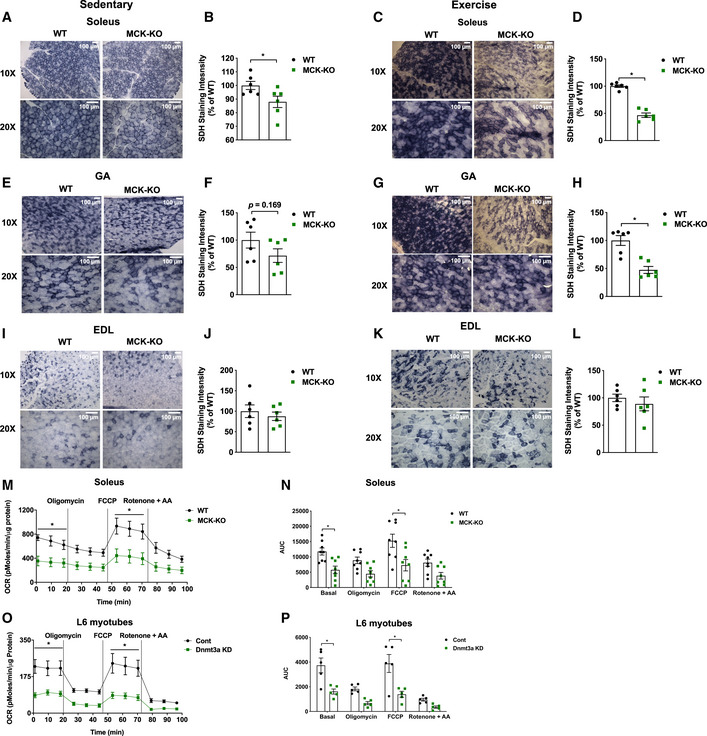
Figure 3. Dnmt3a‐KO soleus muscle displays a decreased oxidative capacity with a reduced mitochondrial respiration.
-
A–DSuccinate dehydrogenase staining was performed in WT and MCK‐KO soleus at sedentary (A, B) and after a bout of low‐intensity exercise for 50 min (C, D; 10×, 20× magnifications), and the staining intensity was quantified using ImageJ (n = 6, means ± SEM, *P < 0.05, two‐tailed Student's t‐test).
-
E–HThe analogous set of data is shown with WT and MCK‐KO GA muscles. (n = 6, means ± SEM, *P < 0.05, two‐tailed Student's t‐test).
-
I–LThe analogous set of data is shown with WT and MCK‐KO EDL muscles. (n = 6, means ± SEM, two‐tailed Student's t‐test. EDL, extensor digitorum longus).
-
M, NMitochondrial respiration was measured in WT and MCK‐KO soleus tissue after a bout of low‐intensity exercise for 50 min under basal conditions and in response to 4 mM oligomycin (complex V inhibitor), 4 mM FCCP (uncoupler), or 4 mM each of rotenone and antimycin A (complex I inhibitor; n = 8, means ± SEM, *P < 0.05, two‐tailed Student's t‐test and two‐way ANOVA followed by Bonferroni post hoc testing). AUC: Area under the curve.
-
O, PMitochondrial respiration was measured in Dnmt3a knocked down L6 myotubes which were transduced with lentiviral under basal conditions and in response to 4 mM oligomycin (complex V inhibitor), 4 mM FCCP (uncoupler), or 4 mM rotenone and antimycin A (complex I inhibitor; n = 5, means ± SEM, *P < 0.05, two‐tailed Student's t‐test and two‐way ANOVA followed by Bonferroni post hoc testing). AUC: Area under the curve.
Source data are available online for this figure.