
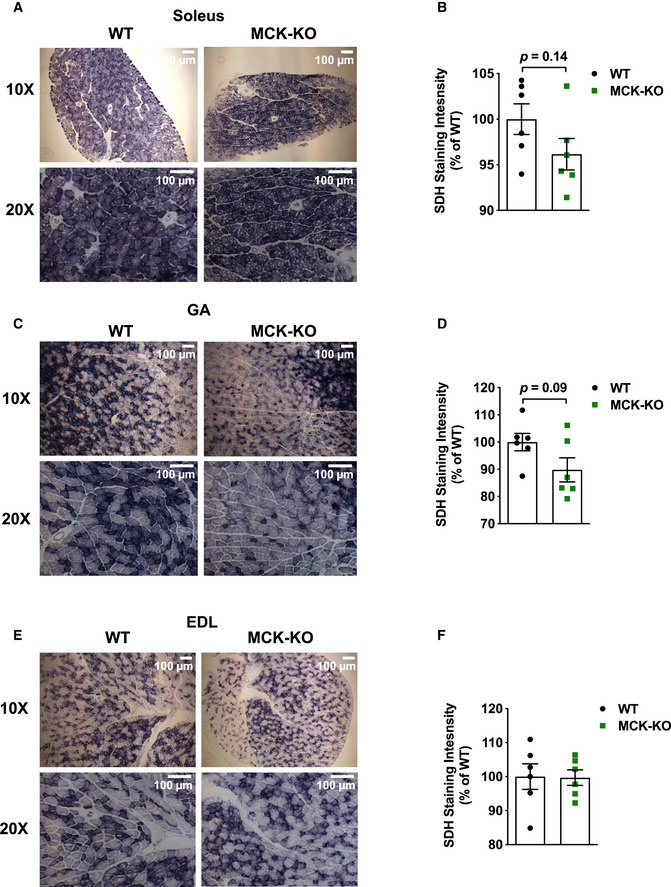
Figure EV4. Dnmt3a‐KO soleus and GA muscles display a decreased trend in oxidative capacity at 5 weeks of age following exercise.
-
A–FSuccinate dehydrogenase staining and quantification was performed in WT and MCK‐KO after a bout of low‐intensity exercise for 50 min in soleus (A, B) GA (C, D) and EDL (E, F; 10×, 20× magnifications), and the staining intensity was quantified using ImageJ (n = 6, means ± SEM, two‐tailed Student's t‐test).
Source data are available online for this figure.