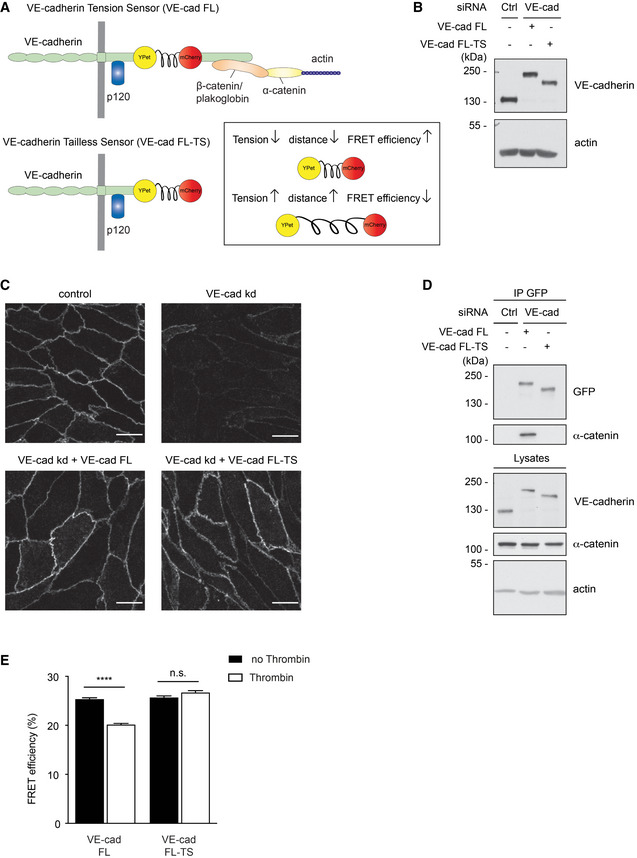
Figure 7. VE‐cadherin tension sensor is suitable to measure induction of force across VE‐cadherin during thrombin stimulation.

- Schematic representation of VE‐cadherin tension sensor (VE‐cad FL) and VE‐cadherin tailless sensor (VE‐cad FL‐TS). VE‐cadherin tension sensor has a ferredoxin‐like (FL) linker‐based FRET module inserted within VE‐cadherin between the p120 and the β‐catenin‐binding site, whereas VE‐cadherin tailless sensor lacks the catenin‐binding region of VE‐cadherin. The FRET module (depicted in box) consists of two fluorophores, YPet and mCherry separated by an elastic domain. When the module is under tension, FRET from YPet to mCherry decreases.
- HUVEC were transfected with control or VE‐cadherin‐specific siRNA and transduced with VE‐cad FL or VE‐cad FL‐TS. Cell lysates were immunoblotted for VE‐cadherin and actin.
- Immunofluorescence staining for VE‐cadherin of HUVEC transfected with control or VE‐cadherin‐specific siRNA (VE‐cad kd) and transduced with VE‐cad FL or VE‐cad FL‐TS.
- HUVEC were either transfected with control or VE‐cadherin targeting siRNA and transduced with VE‐cad FL or VE‐cad FL‐TS. The tension sensor was immunoprecipitated from cell lysates using an anti‐GFP antibody. Precipitates as well as total cell lysates were analyzed by immunoblotting for indicated antigens. Molecular weight markers are indicated in kDa.
- Quantification of FRET efficiency (percentage) in junctions of HUVEC expressing VE‐cad FL or VE‐cad FL‐TS, after thrombin stimulation (1 U/ml) or under control conditions.
Data information: (C, D) Representative pictures from three independent experiments. (E) Graph represents measurements (n = 60, 61, 52, 53) pooled from three independent experiments. Statistical significance was tested with unpaired t‐test, ****P < 0.0001, n.s., not significant. Scale bars 20 µm.
Source data are available online for this figure.
