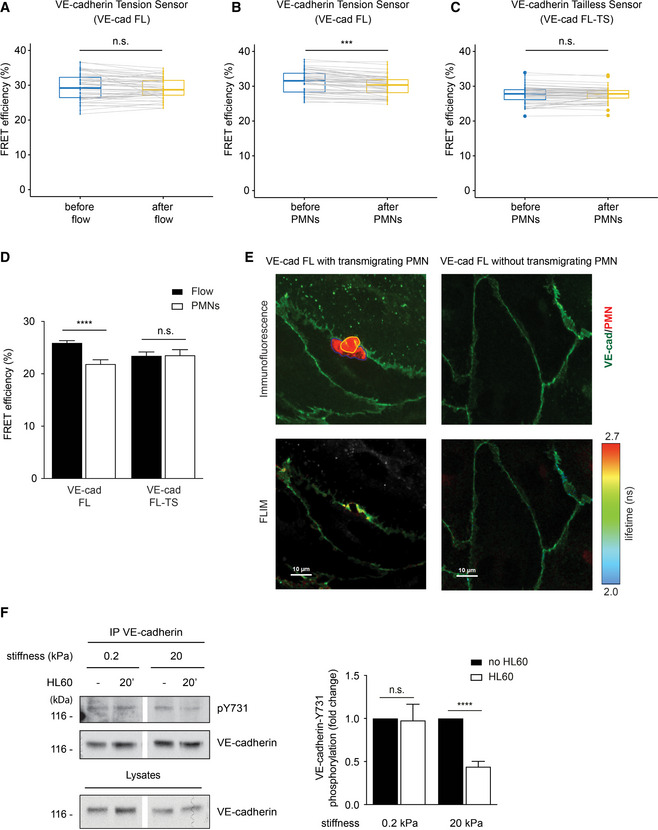
Figure 8. Leukocyte migration through endothelium generates tension on VE‐cadherin required for dephosphorylation of VE‐cadherin‐Y731.

-
A–CQuantification of FRET efficiency (percentage) in junctions of HUVEC expressing VE‐cad FL (A, B) or VE‐cad FL‐TS (C). HUVEC were stimulated 4 h with TNF‐α prior to adding IL‐8 for 4 min, followed by flow with buffer alone (A) or together with PMNs (B, C). The connected data points represent FRET efficiency of same junctions compared before and after addition of flow/PMNs.
-
DQuantification of FRET efficiency (percentage) in junctions of HUVEC expressing VE‐cad FL or VE‐cad FL‐TS. Cells were either exposed to flow and PMNs or to flow alone, fixed using 4% PFA, and washed with PBS. FLIM measurements were performed at sites of transmigration (PMNs) or at junctions without PMNs (Flow).
-
ERepresentative images of HUVEC expressing VE‐cad FL at a site of PMN transmigration (left micrographs) or without PMN (right micrographs). Maximum intensity projection of a Z‐stack of YPet fluorescence (VE‐cadherin in green) and CellTracker DeepRed (PMN in red) is shown for the upper micrographs. The part of the PMN above the HUVEC monolayer is encircled in yellow and the part underneath in blue. The amplitude averaged lifetime of YPet per pixel (FLIM measurement) of the same cells is shown in the bottom micrographs.
-
FHUVEC were grown on collagen‐coated polyacrylamide gels of varying physiologic stiffness of 0.2 and 20 kPa and stimulated with TNF‐α for 17 h prior to adding HL60‐derived neutrophils for 20 min. VE‐cadherin was immunoprecipitated and precipitates as well as total cell lysates were analyzed by Western blotting for indicated antigens. Relative quantifications of pY731 blot signals adjusted to the amount of precipitated VE‐cadherin are shown on the right (from seven independent experiments).
Data information: Graphs represent data from n = 50 (A, B) and 51 (C) measurements pooled from 10 independent experiments. Graph in (D) represents measurements (n = 32, 30, 14, 14) of three independent experiments. Graph in (F) represents data of seven independent experiments. Bars and error bars indicate mean ± SEM. Statistical significance was tested with paired t‐test (A, B, C), and unpaired t‐test (D, F), ****P < 0.0001, ***P < 0.001, n.s., not significant.
Source data are available online for this figure.
