
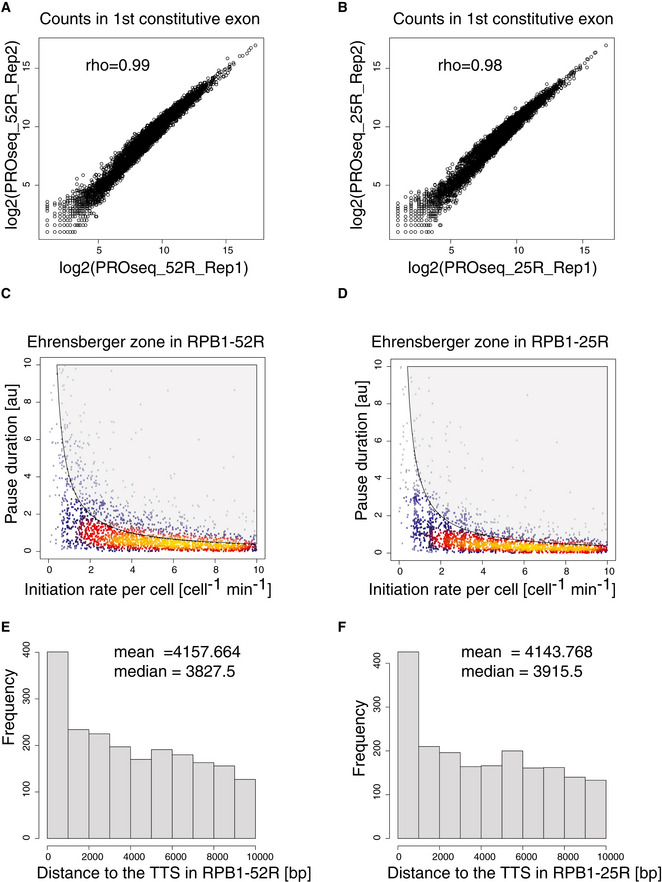
Figure EV2. CTD shortening leads to minor changes in Pol II pausing at steady state.
-
A, BSpearman correlation of read counts in the first constitutive exon of genes encoding major isoforms in biological replicates of PRO‐seq data.
-
C, DScatter plot of pausing duration (d) and productive initiation frequencies (I) in genes encoding major isoforms in RPB1‐52R and RPB1‐25R cells. The gray‐shaded area depicts impossible combinations of I and d according to published kinetic theory (Ehrensberger et al, 2013).
-
E, FHistogram of distances from the PAS to the transcription termination site (TTS) of genes encoding major isoforms.