-
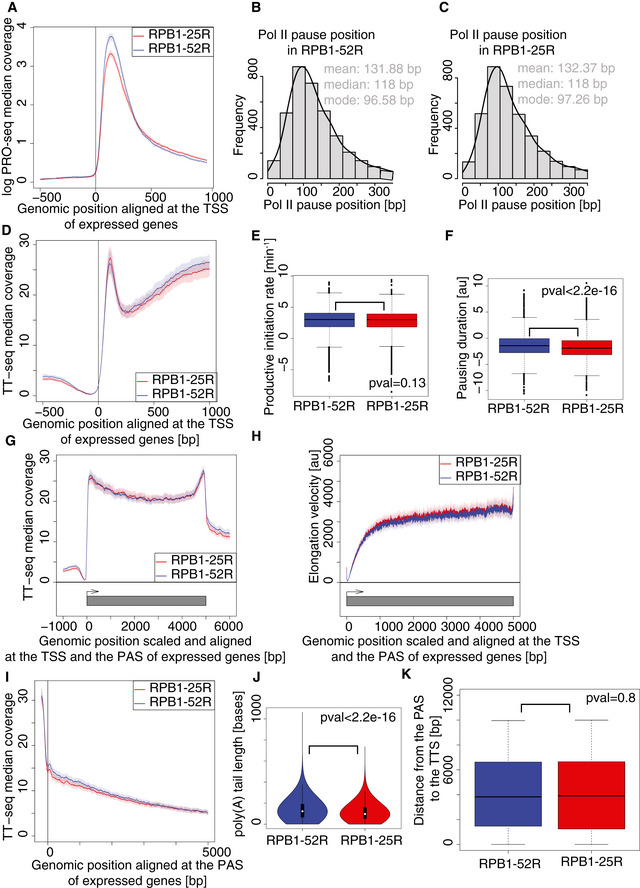
A
CTD shortening leads to a decreased Pol II occupancy in promoter‐proximal region. Median coverage plot of PRO‐seq signal at genes encoding major isoforms. Solid lines represent median signal and shaded area refer to 95% bootstrap confidence intervals. Two independent biological replicates were analyzed.
-
B, C
Pol II pause position remains unchanged upon CTD shortening. Histogram of estimated positions of paused Pol II in RPB1‐52R and RPB1‐25R cells at genes encoding major isoforms with constitutive first exon longer than 100 bp.
-
D
Median coverage plot of TT‐seq signal at genes encoding major isoforms in RPB1‐52R and RPB1‐25R cells. Solid lines represent median signal and shaded area refer to 95% bootstrap confidence intervals. Two independent biological replicates were analyzed.
-
E
Box plot showing productive transcription initiation rate in RPB1‐52R and RPB1‐25R cells for genes encoding major isoforms. P value = 0.13 (Mann–Whitney U‐test) Box limits are the first and third quartiles, the band inside the box is the median. The ends of the whiskers extend the box by 1.5 times the interquartile range. Two independent biological replicates were analyzed.
-
F
Box plot showing Pol II pausing duration in RPB1‐52R and RPB1‐25R cells for genes encoding major isoforms with constitutive first exon longer than 100 bp. P value < 2.2e‐16 (Mann–Whitney U‐test) Box limits are the first and third quartiles, the band inside the box is the median. The ends of the whiskers extend the box by 1.5 times the interquartile range. Two independent biological replicates were analyzed.
-
G
Median scaled coverage plot of TT‐seq signal at genes encoding major isoforms. Solid lines represent median signal and shaded area refer to 95% bootstrap confidence intervals. Two independent biological replicates were analyzed.
-
H
Pol II velocity remains unchanged upon CTD shortening. Metagene profile of transcription elongation velocity at 4,480 genes longer than 10 kb encoding major isoforms. Solid lines represent median signal, and shaded area refer to 95% bootstrap confidence intervals.
-
I
Median coverage plot of TT‐seq signal centered at PAS at genes encoding major isoforms in RPB1‐52R and RPB1‐25R cells. Solid lines represent median signal, and shaded area refer to 95% bootstrap confidence intervals. Two independent biological replicates were analyzed.
-
J
Box plot showing length of the poly(A) tail in RPB1‐52R and RPB1‐25R cells measured using Nanopore sequening data. P value < 2.2e‐16 (Mann–Whitney U‐test) Box limits are the first and third quartiles, the band inside the box is the median. The ends of the whiskers extend the box by 1.5 times the interquartile range. Two independent biological replicates were analyzed.
-
K
Box plot showing distance from the polyadenylation site (PAS) to the transcription termination site (TTS) in RPB1‐52R and RPB1‐25R cells for 1,958 genes encoding major isoforms. P value = 0.8 (Mann–Whitney U‐test) Box limits are the first and third quartiles, the band inside the box is the median. The ends of the whiskers extend the box by 1.5 times the interquartile range.

