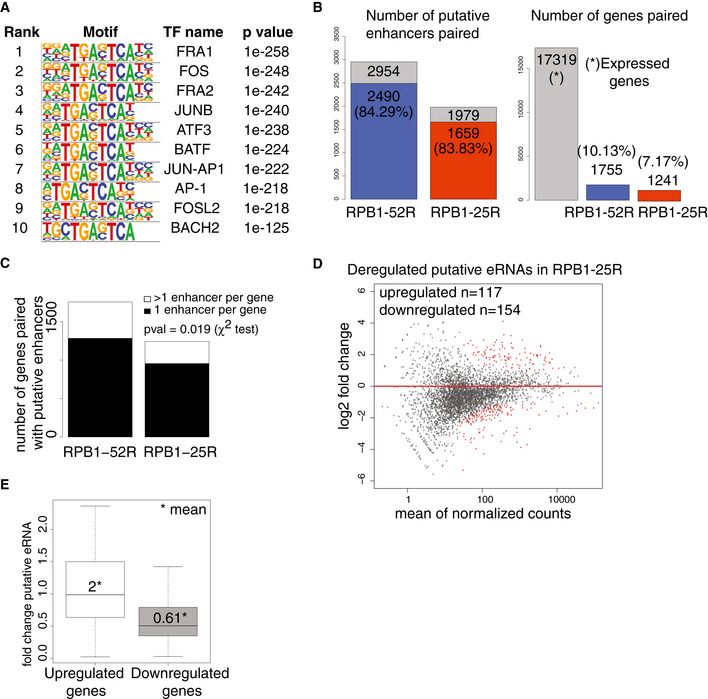
Transcription factor‐binding sites enriches in the area of ± 50 bp from the TSS of putative eRNAs annotated using TT‐seq data in RPB1‐52R and RPB1‐25R cells. P values were determined by the hypergeometric test.
Bar plots showing statistics of our enhancer‐promoter pairing strategy. The left bar plot shows a fraction of annotated putative enhancers that could be paired to promoters using our strategy. 2,490 putative enhancers in RPB1‐52R cells (out of all 2,954 enhancers annotated in RPB1‐52R cells) could be paired with promoters using our strategy (84.29% of all the putative enhancers we annotated in RPB1‐52R could be paired to promoters). In RPB1‐25R cells, 83.83% of annotated putative enhancers could be paired to promoters. The right panel shows a fraction of active promoters in U2OS cells that could be paired to putative enhancers using our strategy. There are 17,319 active promoters in U2OS cells (gray bar). In RPB1‐52R cells, 1,755 of active promoters could be paired with putative enhancers (which constitute 10.13% of all active promoters in RPB1‐52R cells). In the case of RPB1‐25R cells, 1,241 of all active promoters could be paired with putative enhancers (which constitutes 7.17% of all active promoters).
Bar plot showing a number of putative enhancers paired per gene in RPB1‐52R and RPB1‐25R cells. P value = 0.019 (χ2 test).
MA plot showing changes in putative eRNAs synthesis upon CTD shortening in U2OS cells in steady state conditions. RPB1‐52R cells are used as a control and the data were normalized using spike‐in counts. 4,335 putative eRNAs were analyzed, 117 putative eRNAs were significantly upregulated (adjusted P value < 0.05, log2 fold change ≥ 1, depicted in red) and 154 putative eRNAs were significantly downregulated (adjusted P value < 0.05, log2 fold change ≤ 1, depicted in red).
Boxplot showing changes in putative eRNA synthesis if paired with genes that were significantly upregulated (adjusted P value < 0.05, log2 fold change ≥ 1) (left box) or significantly downregulated (adjusted P value < 0.05, log2 fold change ≤ 1) (right box) upon CTD shortening. Box limits are the first and third quartiles, the band inside the box is the median. The ends of the whiskers extend the box by 1.5 times the interquartile range. Two independent biological replicates were analyzed.