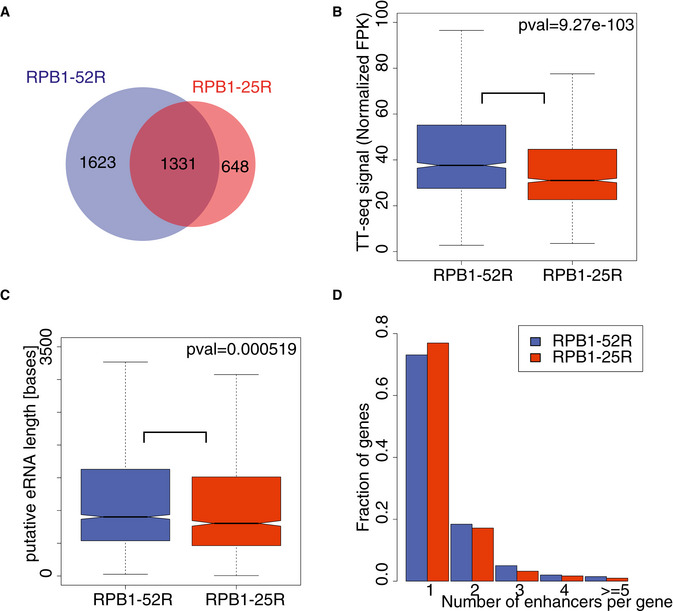
Figure 4. CTD shortening in human cells alters transcribed putative enhancers.

- Pie chart showing numbers of putative eRNAs annotated using TT‐seq data in RPB1‐52R and RPB1‐25R cells.
- Box plots showing RNA synthesis levels (RPKs) of putative eRNAs annotated using TT‐seq data in RPB1‐52R and RPB1‐25R cells. P value = 9.27e‐103 (Mann–Whitney U‐test) Box limits are the first and third quartiles, the band inside the box is the median. The ends of the whiskers extend the box by 1.5 times the interquartile range. Two independent biological replicates were analyzed.
- Box plots showing lengths of putative eRNAs annotated using TT‐seq data in RPB1‐52R and RPB1‐25R cells. P value = 0.000519 (Mann–Whitney U‐test) Box limits are the first and third quartiles, the band inside the box is the median. The ends of the whiskers extend the box by 1.5 times the interquartile range. Two independent biological replicates were analyzed.
- Histogram showing a distribution of number of putative eRNAs paired to genes in RPB1‐52R and RPB1‐25R cells.
