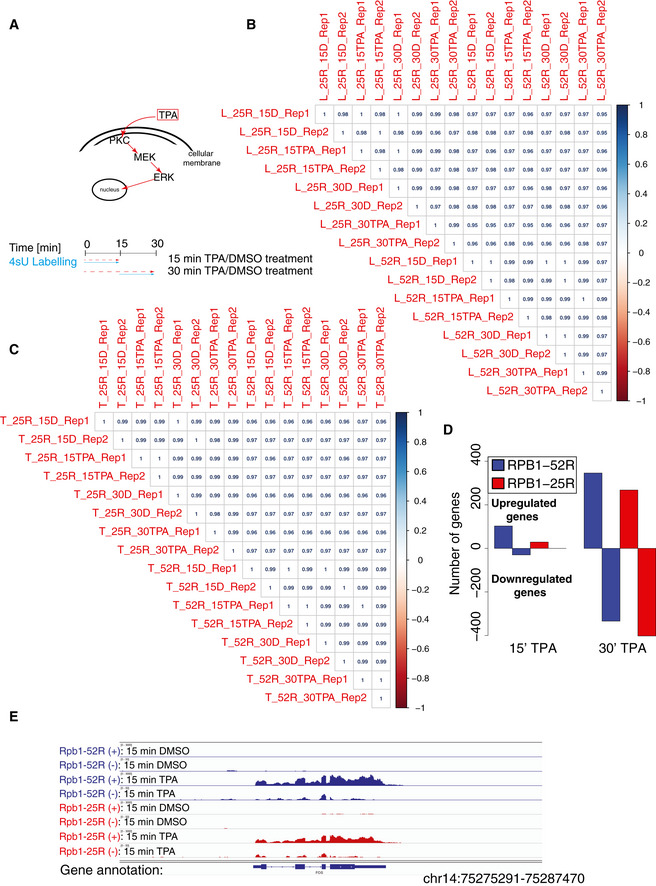
Figure EV4. CTD shortening impairs transcription induction.

-
ASchematic representation of the experimental procedure used to study the effects of CTD shortening on TPA‐induced transcription.
-
B, CSpearman correlation of read counts in RefSeq genes of biological replicates in TT‐seq (B) and RNA‐seq (C) in RPB1‐52R and RPB1‐25R cells upon 15 and 30 min of TPA treatment (200 nM) and the respective DMSO controls.
-
DBar plot showing number of RefSeq genes that change RNA synthesis in TT‐seq datasets in RPB1‐52R and RPB1‐25R upon 15‐ and 30‐min treatment with TPA (200 nM). Genes showing adjusted P value < 0.05 and log2 fold change ≥ 1 were considered as significantly upregulated and genes showing adjusted P value < 0.05 and log2 fold change ≤ 1 were considered as significantly downregulated.
-
EExemplary genome browser view showing TT‐seq read coverage over FOS gene in RPB1‐52R and RPB1‐25R cells upon 15 min of TPA treatment (200 nM).
