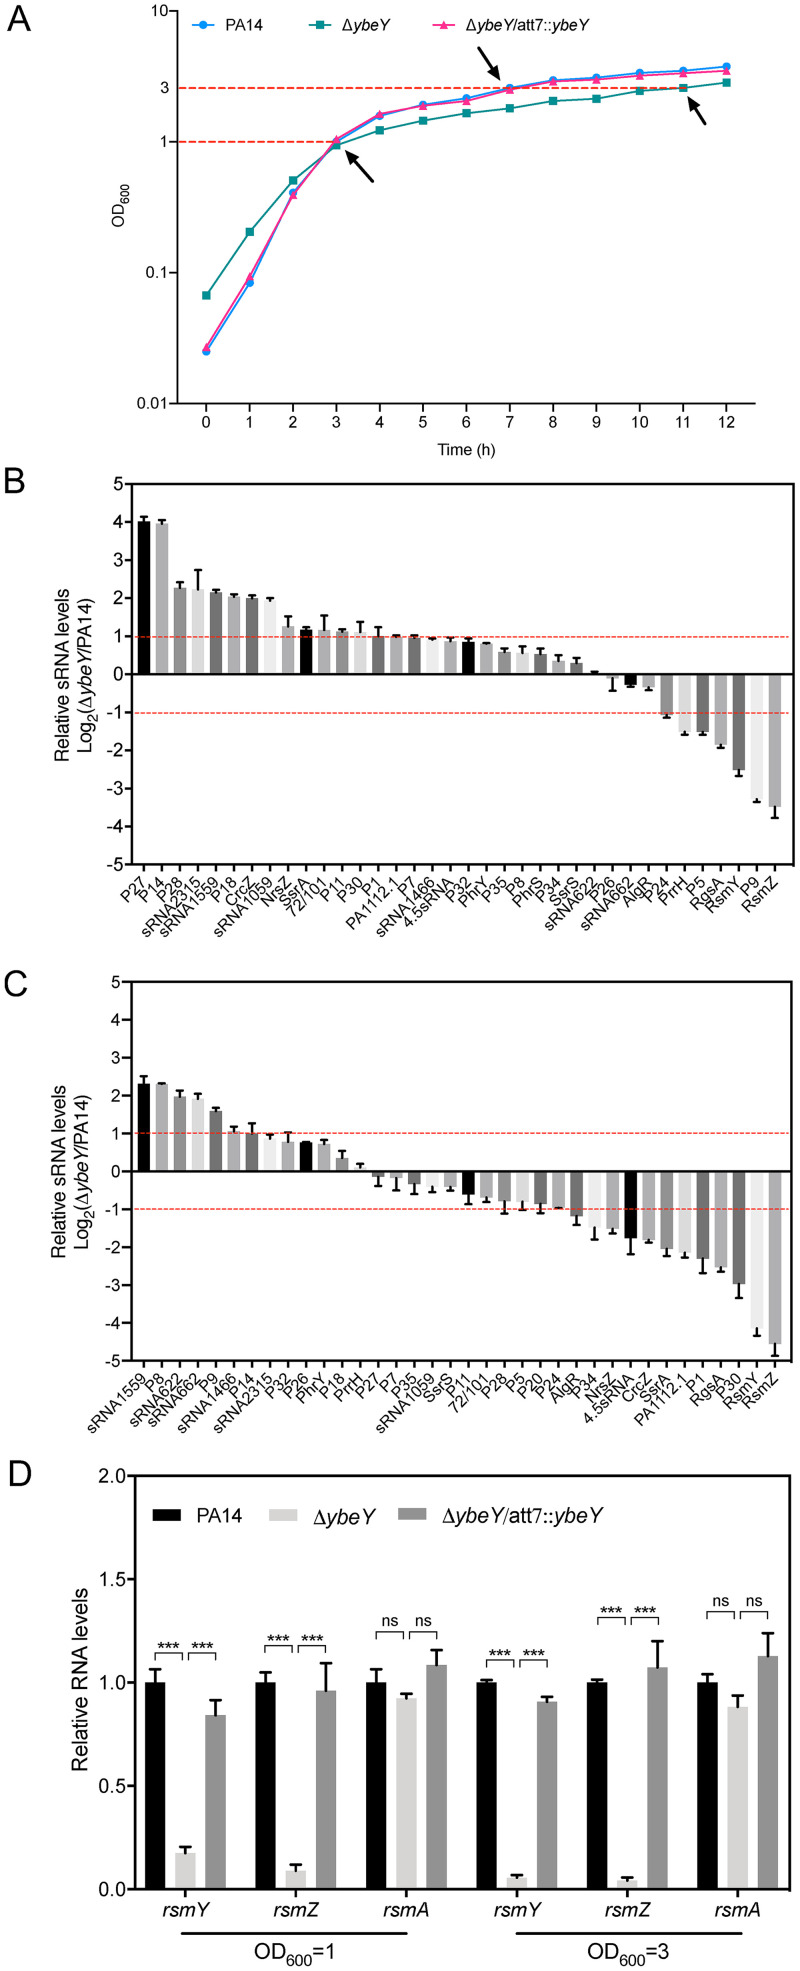
FIG 2.
YbeY controls the expression of sRNAs but not the expression of rsmA. (A) The growth curves of wild-type PA14, the ΔybeY mutant, and the complemented strain. The bacteria were grown in LB overnight. Aliquots of 0.3 ml of the cultures of the wild-type PA14 and the complemented strain or 0.9 ml of the culture of the ΔybeY mutant were subcultured into 30 ml fresh LB medium and grown at 37°C with agitation at 200 rpm. The OD600 was monitored every hour for 12 h. The sample collection points are indicated by arrows. Bacteria were grown to an OD600 of 1 (B) or 3 (C). Total RNA was purified, and the relative sRNA levels were determined by RT-qPCR. The relative levels of the small RNAs in the ΔybeY mutant compared to those in wild-type PA14 are shown. Results represent means ± SD. The red lines represent a fold change of 2. (D) The bacteria were grown in LB to an OD600 of 1 or 3. The relative RNA levels of rsmY-rsmZ and rsmA were determined by RT-qPCR. Results represent means ± SD. ***, P < 0.001 by Student's t test. ns, not significant.

