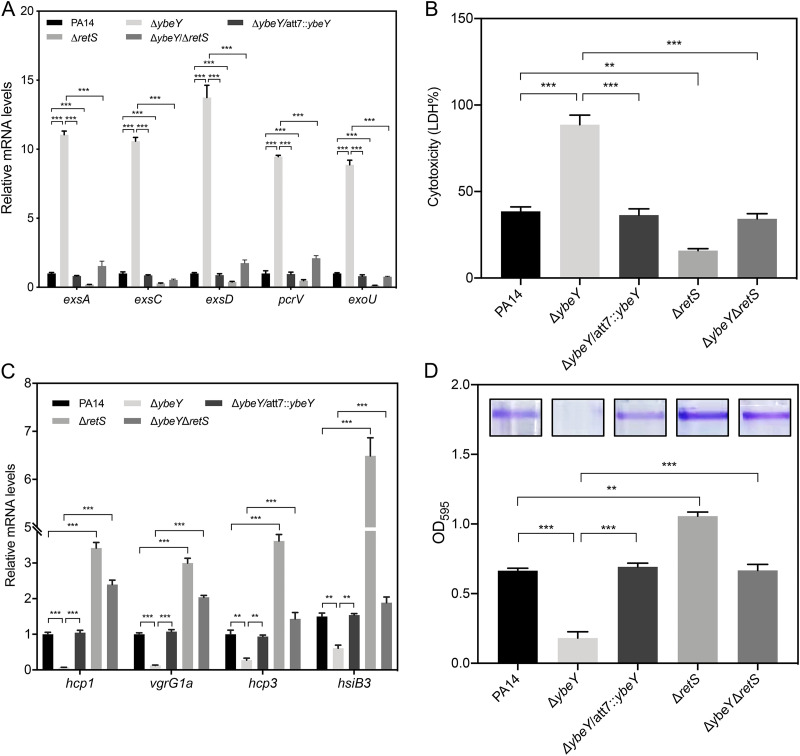
FIG 5.
YbeY controls biofilm formation and the expression of T3SS and T6SS genes through RetS. (A) The indicated strains were grown in LB to an OD600 of 1. The relative mRNA levels of the T3SS genes were determined by RT-qPCR. Results represent means ± SD. (B) A549 cells were infected with the indicated strains at an MOI of 50 for 3 h. The relative cytotoxicity was determined by the LDH release assay. (C) The indicated strains were grown in LB to an OD600 of 1. The relative mRNA levels of the T6SS genes were determined by RT-qPCR. Results represent means ± SD. (D) The indicated strains were grown in 96-well plates for 20 h. The wells were washed with PBS and stained with 1% crystal violet. The crystal violet was dissolved in ethanol and measured at a wavelength of 595 nm. Results represent means ± SD. **, P < 0.01; ***, P < 0.001; both by Student's t test.

