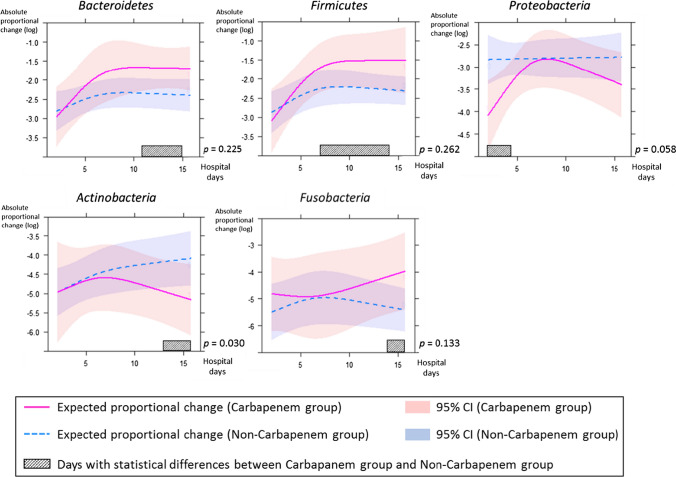
Fig. 3.
The absolute proportional changes from the first sample of each phylum between the carbapenem group and non-carbapenem group are shown. The amount of variation is indicated as a natural logarithmic value on the y axis. Each line and zone indicate an expected proportional change and the 95% confidence interval (CI) (carbapenem group = red, non-carbapenem group = blue). Shaded bars indicate days with a statistically significant difference between two groups. P indicates the p-value for interaction between hospital days and groups

