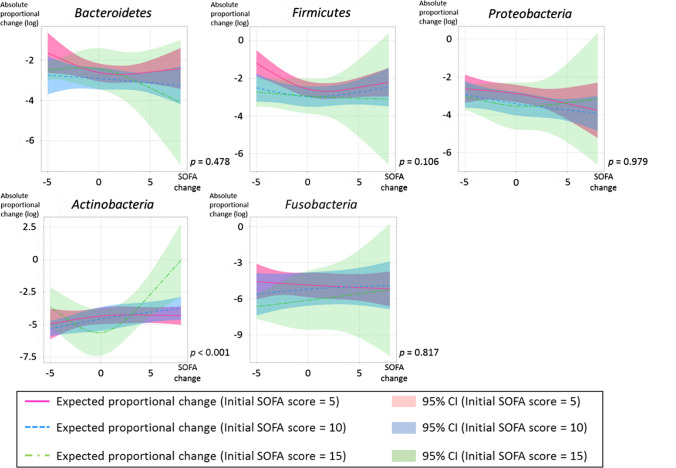
Fig. 5.
The absolute proportional changes from the first sample of each phylum, with interaction of initial SOFA score and changes in SOFA score, are shown. The amount of variation is indicated as a natural logarithmic value on the y axis. Each line and zone indicate an expected proportional change and the 95% confidence interval (CI) (initial SOFA score is indicated by color: 5 = red, 10 = blue, 15 = green). P indicates the p-value for interaction between initial SOFA score and changes in SOFA score

