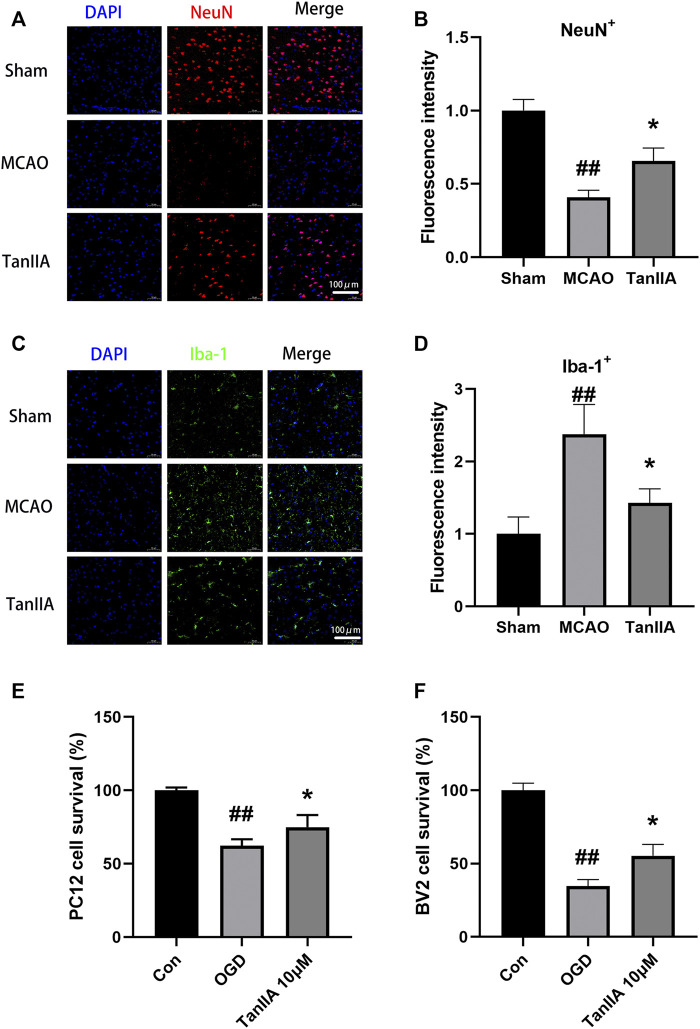
FIGURE 4.
Effects of Tanshinone IIA on neuroprotection in vivo and in vitro. Immunofluorescence staining was used to detect the levels of NeuN-positive neuron (A) and Iba-1-positive microglia (C) in rat ischemic penumbra area. NeuN was shown as red, Iba-1 was shown as green and DAPI was shown as blue (Scale bar: 100 μm). (B) Fluorescence intensity of NeuN-positive neuron in rat ischemic penumbra area. (D) Fluorescence intensity of Iba-1-positive microglia in rat ischemic penumbra area. ##p < 0.01, compared with the Sham group, *p < 0.05, compared with the MCAO group. Sham, sham operation group; MCAO, middle cerebral artery occlusion; TanIIA, Tanshinone IIA, n = 3. OGD-induced BV2 cells were treated with Tanshinone IIA. CCK-8 assay was used to measure the cell survival of PC12 cells (E) and BV2 cells (F) after oxygen-glucose deprivation (OGD). ##p < 0.01, compared with the control group, *p < 0.05, compared with the OGD group. Con, control group; OGD, oxygen-glucose deprivation; TanIIA, Tanshinone IIA, n = 6.

