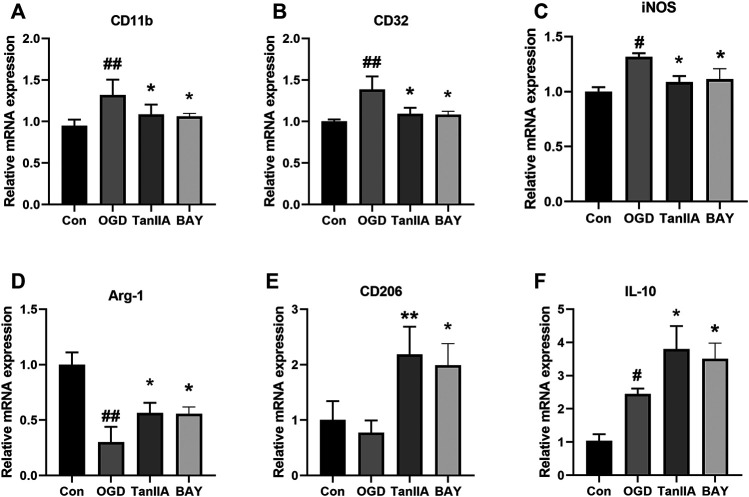
FIGURE 6.
Effect of Tanshinone IIA on polarization-related mRNA expressions after OGD in BV2 cells. OGD-induced BV2 cells were treated with Tanshinone IIA. Quantitative RT-PCR was used to assess the mRNA expression levels of M1 microglia markers: CD11b (A), CD32 (B), iNOS (C), and M2 microglia markers: Arg-1 (D), CD206 (E), IL-10 (F). ##p < 0.01, compared with the Con group, *p < 0.05, compared with the OGD group. Con, control group; OGD, oxygen-glucose deprivation; TanIIA, Tanshinone IIA. BAY, BAY-11-7082, a NF-κB inhibitor, n = 3.

