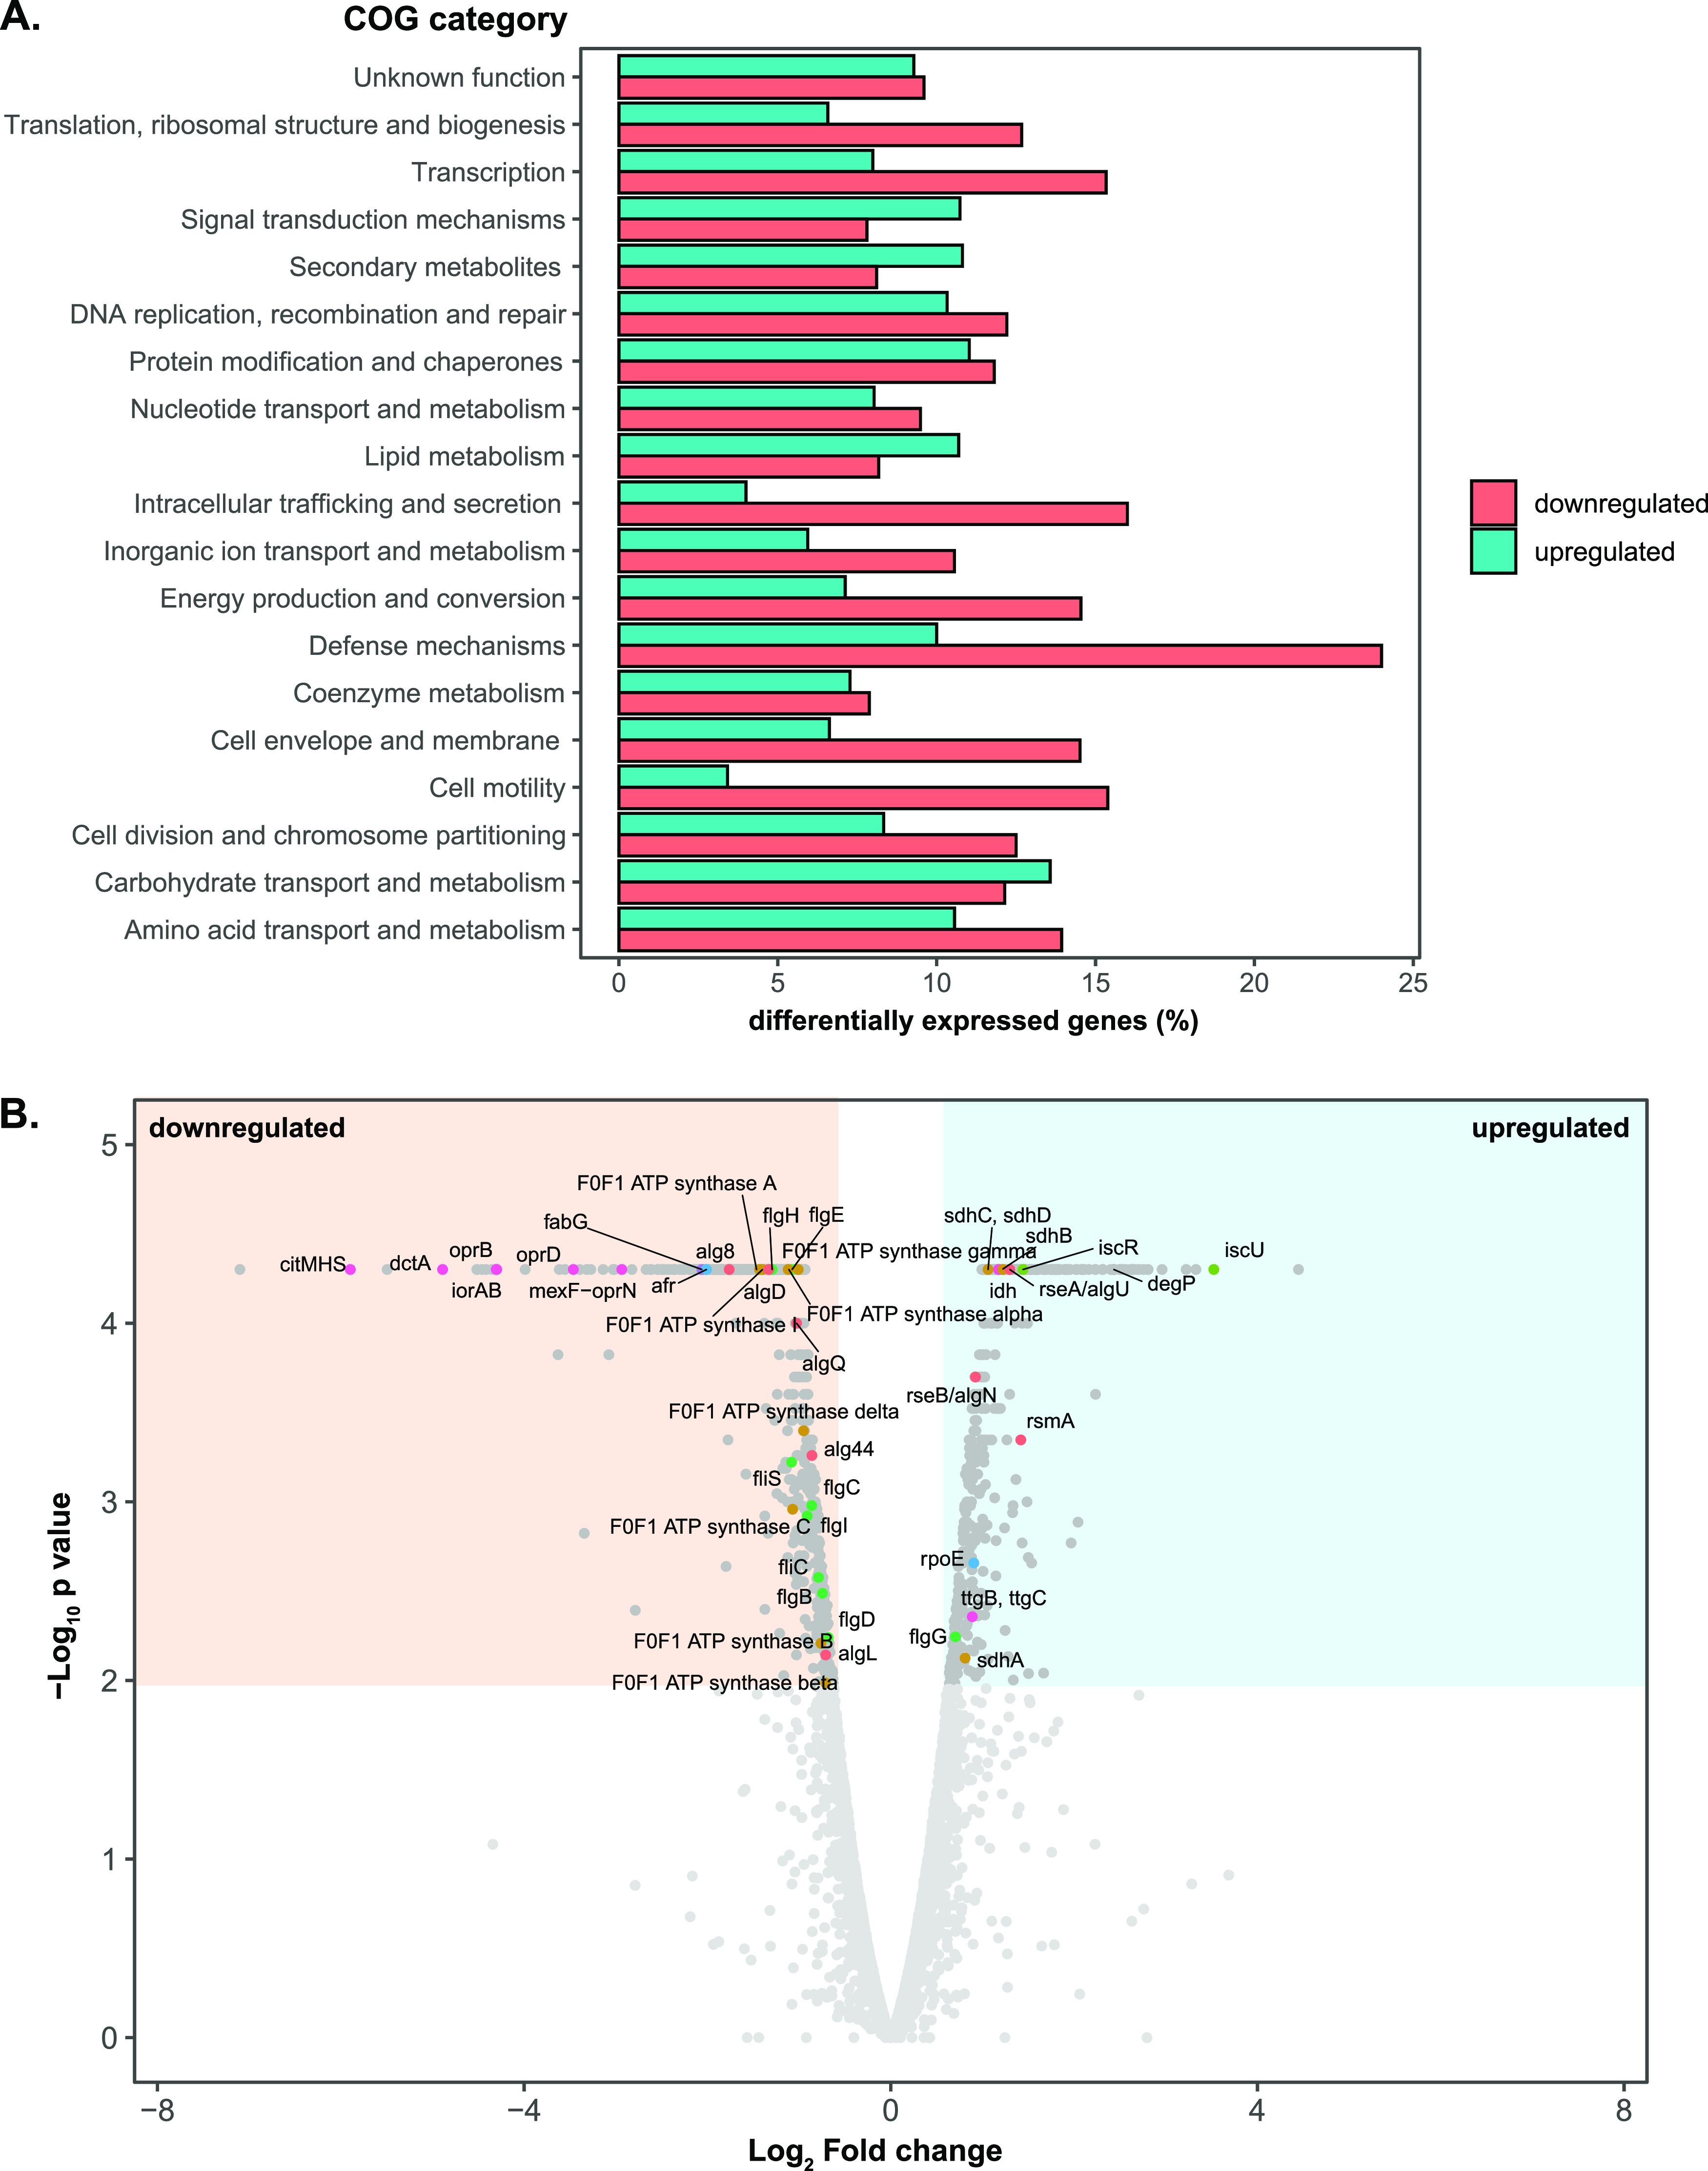
FIG 5.

Visualization of differentially expressed genes on ALE-derived P. putida S12 strains in comparison to the parental strain growing on LB medium. (A) COG classification of differential gene expression in ALE-derived strains in comparison to plasmid-cured P. putida S12. COG classification was performed using eggNOG 5.0 mapper (http://eggnogdb.embl.de/#/app/emapper). The percentages of upregulated genes in each class are represented by blue bars, and the percentages of downregulated genes are represented by red bars. (B) Volcano plot of differential gene expression in ALE-derived strains in comparison to the plasmid-cured P. putida S12 growing on LB medium. The blue area indicates the significantly upregulated genes, and the beige area indicates the significantly downregulated genes (cutoff, log2 fold change of ≥1 for upregulated genes or ≤1 for downregulated genes and a P value of ≤0.01). The colored dots represent the significantly up- or downregulated genes discussed in this paper. Colors correspond to the function of each gene, as follows: red represents biofilm and alginate production genes, orange represents the genes involved in the oxidative phosphorylation process, light green represents the genes involved in the energy production process, green represents flagellar assembly gene clusters, blue represents sigma factor and transcriptional regulator genes, and magenta represents the genes which constitute membrane transporters.
