
Figure 2.
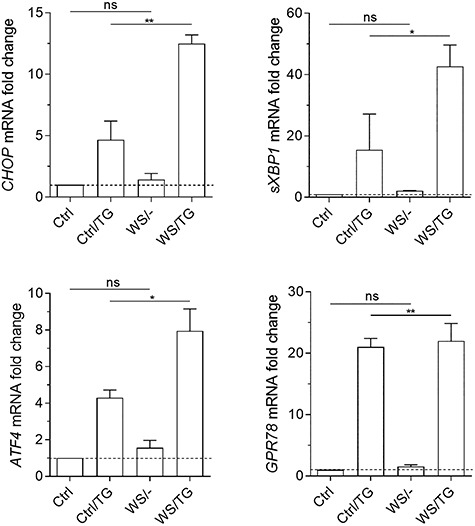
ER stress markers transcripts analyses. Real-time PCR analysis of CHOP, sXBP1, ATF4, GRP78 transcripts in healthy controls (Ctrl) or PBMCs from the WS patient, untreated or treated with TG at 0.5 μM for 48 h. Data were normalized to the expression of ACTB (encoding β-actin) and presented relative to results in healthy controls untreated cells (dotted line, 1-fold). Data were analyzed by one-way ANOVA followed by post hoc Bonferroni’s test. ns, not significant; *P < 0.05; **P < 0.01.