
Figure 4.
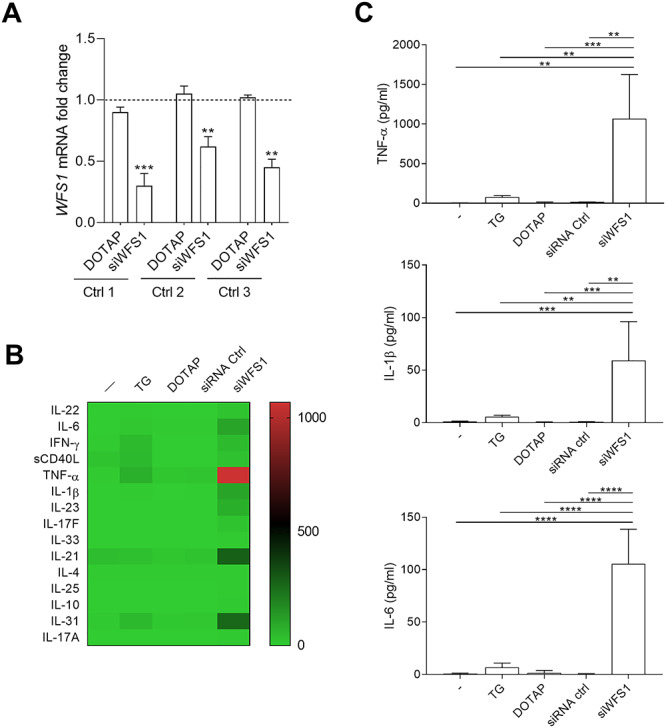
Production of proinflammatory cytokines after silencing of the WFS1 gene in PBMCs from healthy donors. (A) The mRNA level of WFS1 after transfection with WFS1 siRNA was detected by real-time PCR in PBMCs of three healthy donors. Control cells were treated with vehicle alone (DOTAP). Data were normalized to the expression of ACTB (encoding β-actin) and presented relative to results in untreated cells (dotted line, 1-fold). One experiment is shown representative of three. Data were analyzed by one-way ANOVA followed by post hoc Bonferroni’s test. (B) Schematic heat map representation of Bio-Plex Pro Human Th17 cytokine panel. The cytokine profile was analyzed in supernatants from PBMCs of healthy donors untransfected or transfected with siWFS1 or a scramble siRNA. Vehicle alone (DOTAP) was used as a control. Individual expression levels of selected cytokines were reported in (C). Data were analyzed by one-way ANOVA followed by post hoc Bonferroni’s test. **P < 0.01; ***P < 0.001; ****P < 0.0001.