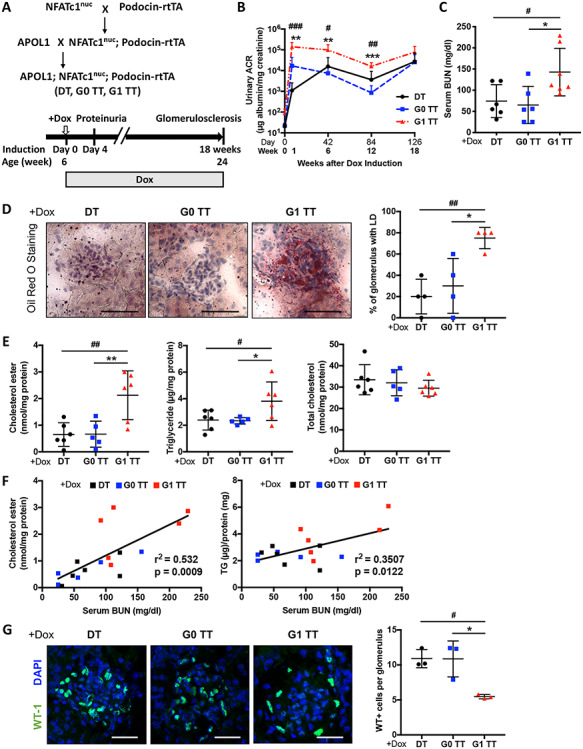
Figure 2 .

Podocyte-specific NFAT activation in mice carrying the APOL1 G1 allele (G1 TT) causes increased proteinuria, serum BUN and renal lipid accumulation. (A) Experimental design to generate wildtype; Podocin-rtTA; NFATc1nuc mice (DT), APOL1 G0; Podocin-rtTA; NFATc1nuc (G0 TT) and APOL1 G1; Podocin-rtTA; NFATc1nuc (G1 TT) transgenic mice (upper panel). Doxycycline induction was initiated at 6 weeks of age and was continued for 18 weeks. Mice were sacrificed at 24 weeks of age (lower panel). (B) Urinary albumin-to-creatinine ratio in DT, G0 TT mice and G1 TT mice. Urines were collected before doxycycline induction and 1, 6, 12, 18 weeks after induction (n = 6). (C) Scatter plots of BUN level of TT mice fed doxycycline chow for 18 weeks (n = 6–7). (D) Representative Oil Red-O (ORO) images of stained kidney cortices sections from TT mice fed doxycycline chow for 18 weeks (scale bars: 50 μm) and quantification of the number of glomeruli with lipid droplets (LD) in ORO stained slides from four mice per group (n = 4). (E) Scatter plots of cholesterol ester (ce), triglyceride (TG) and total cholesterol (TC) contents in kidney cortices of TT mice fed doxycycline chow for 18 weeks. Values are normalized to protein concentrations (n = 5–6). (F) Correlation analyses between the ce content of kidney cortices and BUN and between the TG content of kidney cortices and BUN (n = 17). (G) Representative images of kidney cortices of TT mice fed doxycycline chow for 18 weeks stained with WT1 (green) to detect podocytes and DAPI (blue) to reveal nuclei (scale bars: 25 μm) and quantification of the average number of WT1-positive podocytes per glomerulus in WT1 stained slides from three mice per group (n = 3). The error bars represent mean ± SD of biologically independent experiments. One-way ANOVA followed by Dunnett’s test (B–E and G); Pearson’s correlation coefficient (F). *P (#P) < 0.05, **P (##P) < 0.01, ***P (###P) < 0.001. #DT compared with G1 TT, *G0 TT compared with G1 TT.
