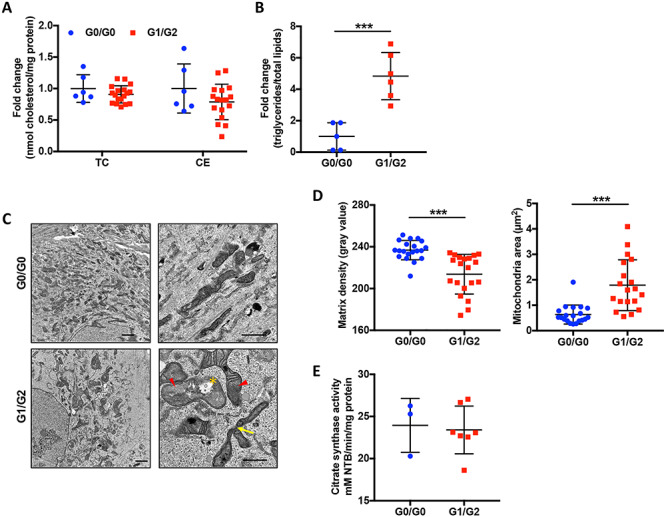
Figure 4 .

Human urinary podocytes carrying APOL1 G1/G2 risk alleles are characterized by increased triglyceride content and changes in mitochondrial morphology. (A and B) Scatter plot quantification of total cholesterol (TC), cholesterol ester (ce) (A) and triglyceride (TG) (B) content in G0/G0 and G1/G2 expressing podocytes (n = 6 & 18). (C) Representative TEM images of G0/G0 and G1/G2 expressing podocytes. The arrow heads point to mitochondria with loss of cristae membranes and matrix swelling; the asterisks indicate rupture of outer mitochondrial membrane and the arrows point to hyperbranched mitochondria. Scale bar: 2 μm (left), 1 μm (right). (D) Scatter plots of matrix density of mitochondria and mitochondrial size quantified from at least five different images using ImageJ (n = 20). (E) Scatter plot quantification of citrate synthase activity determined by the rate of absorbance gain at 412 nm normalized to protein concentration (n = 3 & 7). The error bars represent mean ± SD of biologically independent experiments. Two-tailed Student’s t-test. ***P < 0.001.
