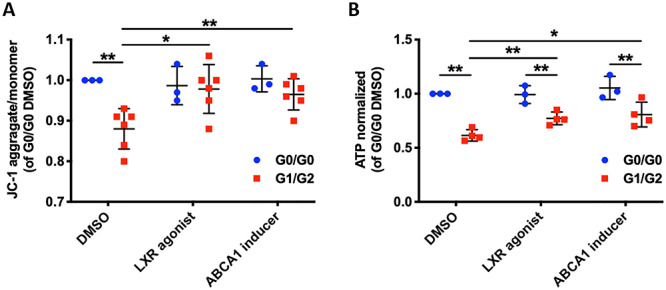
Figure 6 .

Lipid-modifying agents improve mitochondrial membrane potential and ATP production in G1/G2 expressing podocytes. (A) Scatter plot of mitochondrial membrane potential determined by JC-1 probe comparing G0/G0 and G1/G2 expressing podocytes treated with lipid-modifying agents (n = 3 & 6). (B) Scatter plot of ATP content normalized to cell number comparing G0/G0 and G1/G2 expressing podocytes treated with lipid-modifying agents (n = 3 & 4). The error bars represent mean ± SD of biologically independent experiments. Two-tailed Student’s t-test. *P < 0.05, **P < 0.01.
