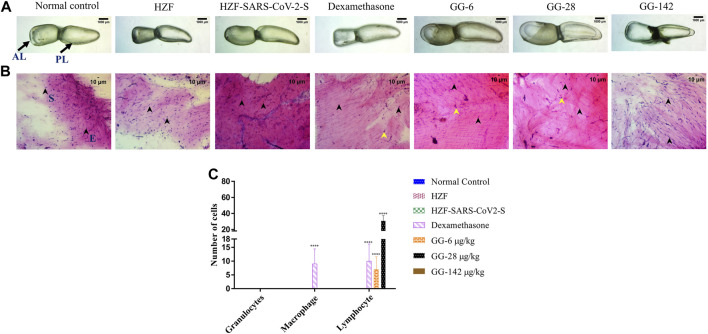
FIGURE 4.
Comparison of changes in swim bladder morphology, cytology, and immune cell infiltrates at 7-days time point. (A) Morphological changes in swim bladder with SARS-CoV-2 spike-protein induction, and treatment with Dexamethasone and Giloy Ghanvati (GG) at different concentrations (6, 28, and 142 μg/kg/day) compared to the normal control and humanized zebrafish. Images depict lateral view with the anterior lobe (AL) and posterior lobe (PL) marked. Images were taken at ×1 magnification. (B). Hematoxylin-Eosin stained cytology smears of whole swim bladder captured using ×20 objective magnification. Normal cell nuclei depicted by black arrowheads; E- Epithelial cells, and S- Smooth muscle cells. Yellow arrowheads in the images show lymphocytes. (C) Quantitative estimation of immune cell infiltrates in the swim bladder. Data points are depicted as mean ± S.D. analyzed by Two-Way ANOVA followed by Tukey’s multiple comparisons test. (****) p < 0.0001 compared to disease control, n = 24.

