FIGURE 9.

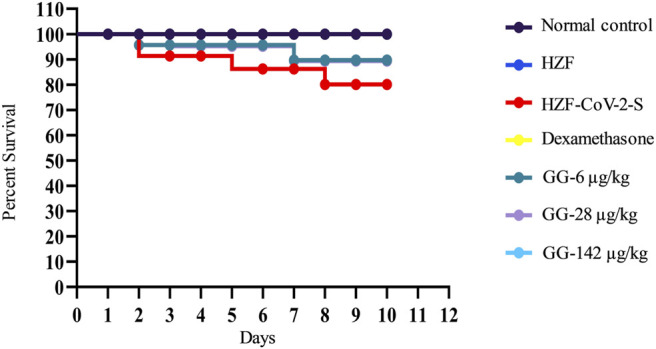
Mortality in the different study groups was recorded every day for 10 days in a parallel experiment. Survival analysis is presented as Kaplan-Meier curve.

Mortality in the different study groups was recorded every day for 10 days in a parallel experiment. Survival analysis is presented as Kaplan-Meier curve.