Figure 4.

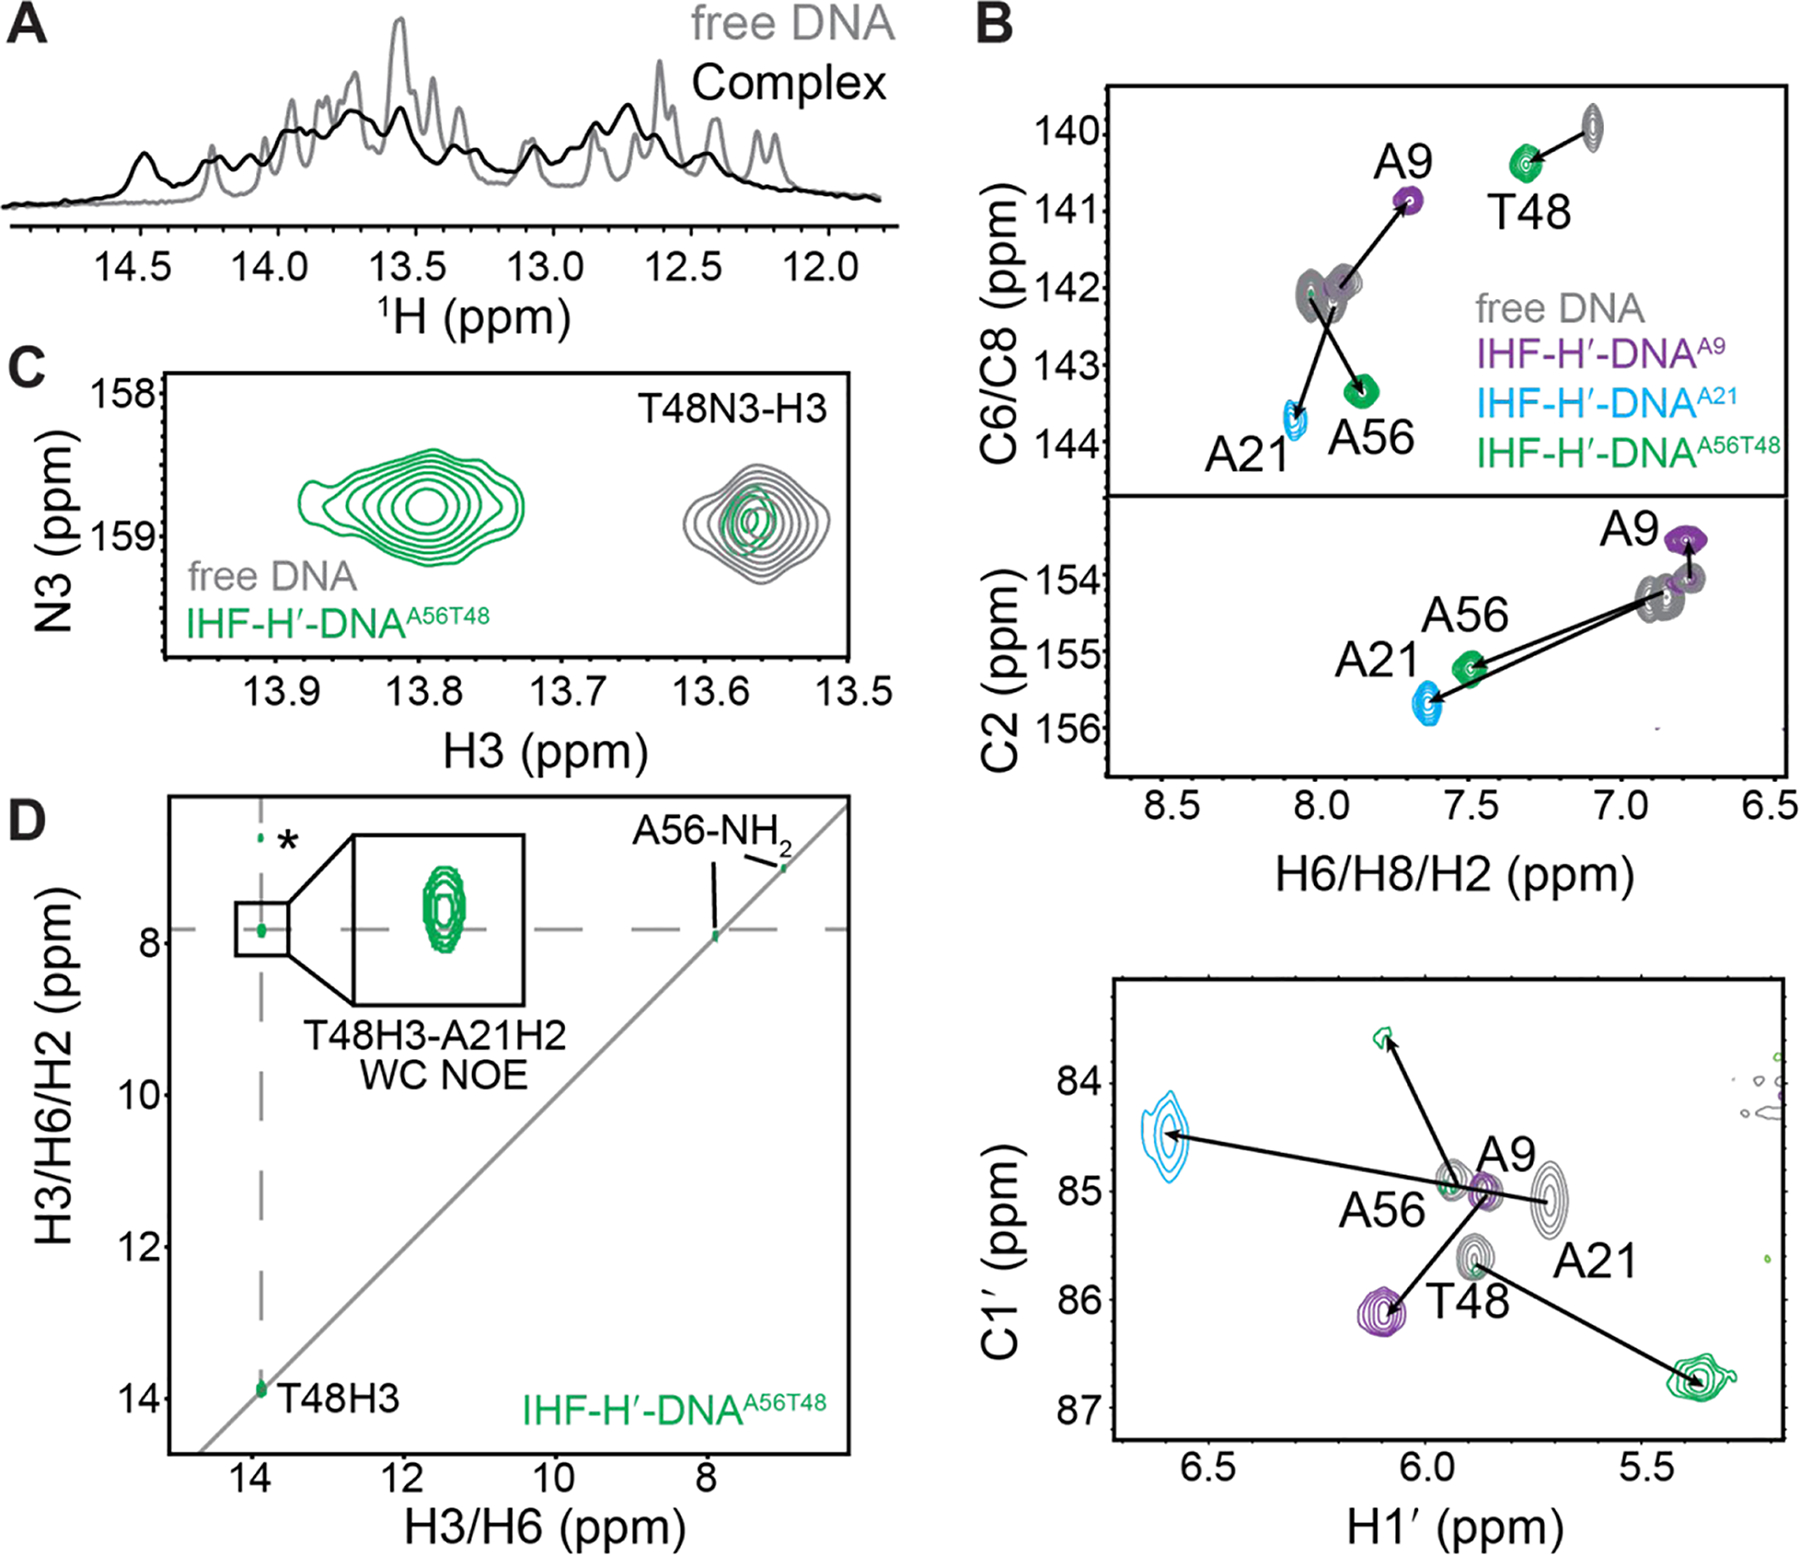
NMR analysis of IHF-DNA complex formation. (A) 1D 1H spectra showing imino proton resonances in the IHF-H′-DNAA56T48 complex overlaid with unbound DNA. (B) 2D [13C, 1H] TROSY HSQC spectra for IHF-DNA complexes (colored) overlaid with unbound DNA (in grey). Chemical shift perturbations are indicated by the black arrows. (C) Overlay of 2D [15N,1H] SOFAST HMQC spectra for IHF-H′-DNAA56T48 complex (in green) and unbound H′-DNAA56T48 (in gray) at 37 °C. Minor unbound DNA population is observed in the spectrum consistent with slow exchange. Complex-only spectra are shown in Figure S3. (D) 2D 15N-edited [1H, 1H] NOESY spectrum for IHF-H′-DNAA56T48 complex shows T48H3-A21H2 NOE cross-peaks consistent with Watson-Crick pairing at A21-T48 bp. The T48H3-A21H1′ NOE assignment (labeled with *) is tentative and we cannot rule out that the resonance assigned to A21H1′ corresponds to other neighboring sugar or amino protons.
