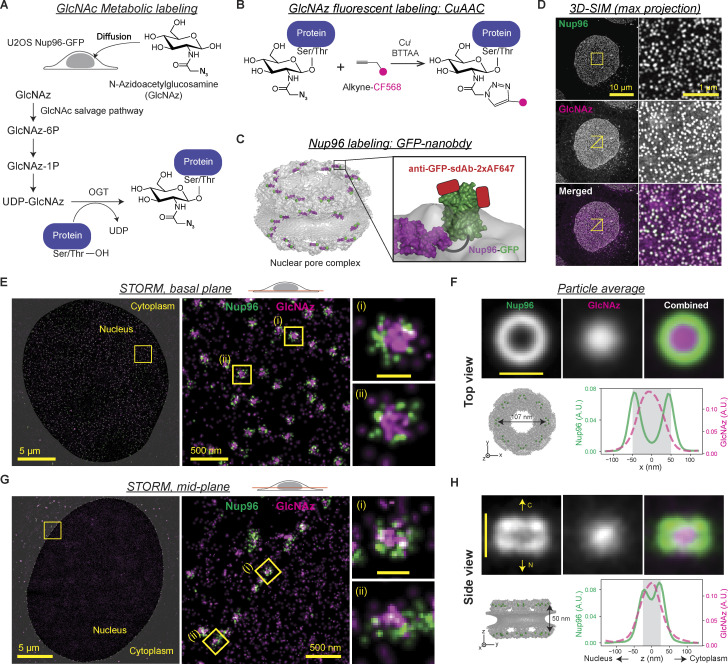
Figure 4.
O-GlcNAc is highly abundant at the central transport channel of the symmetric core of the NPC. (A–C) In situ fluorescent labeling of Nup96 and O-GlcNAc sites in U2OS cell. (A) Metabolic labeling of O-GlcNAc site. GlcNAz is incorporated into proteins via GlcNAc salvage pathway and OGT activity. (B) The incorporated GlcNAz moieties were labeled with CF568 via CuAAC. (C) Nup96 (purple) was endogenously tagged with GFP (green) at the C-terminus. After fixation, each GFP molecule was labeled with up to two anti-GFP single-domain antibodies conjugated with two AF647 (red). (D) Maximum-intensity projection of 3D SIM image of the double-stained cells. Left column: Full field of view. Right column: Enlarged region of interest (yellow square). (E and G) Representative two-color STORM images of the basal plane (E) and midplane (G) of the nucleus showing the top and side views of the NPCs, respectively. Each localization of molecules is rendered as a normalized gaussian whose SD is set to the localization precision. (F and H) Top: Averaged top (F) or side view (H) STORM image of the NPCs (703 top views from four cells; 122 side views from four cells). Bottom left: Structure (Protein Data Bank accession no. 5A9Q) of the NPC symmetric core, where the C-terminus of Nup96 is marked with a green sphere. Bottom right: Averaged intensity profiles of Nup96-GFP:AF647 (green, solid) and GlcNAz:CF568 (magenta, dashed) along the x axis (F) or z axis (H). Nup96-GFP:AF647 is colored in green and GlcNAz:CF568 in magenta in all merged 3D SIM and STORM images in D–H. Scale bars in individual and averaged pore images in E–H, 100 nm.

