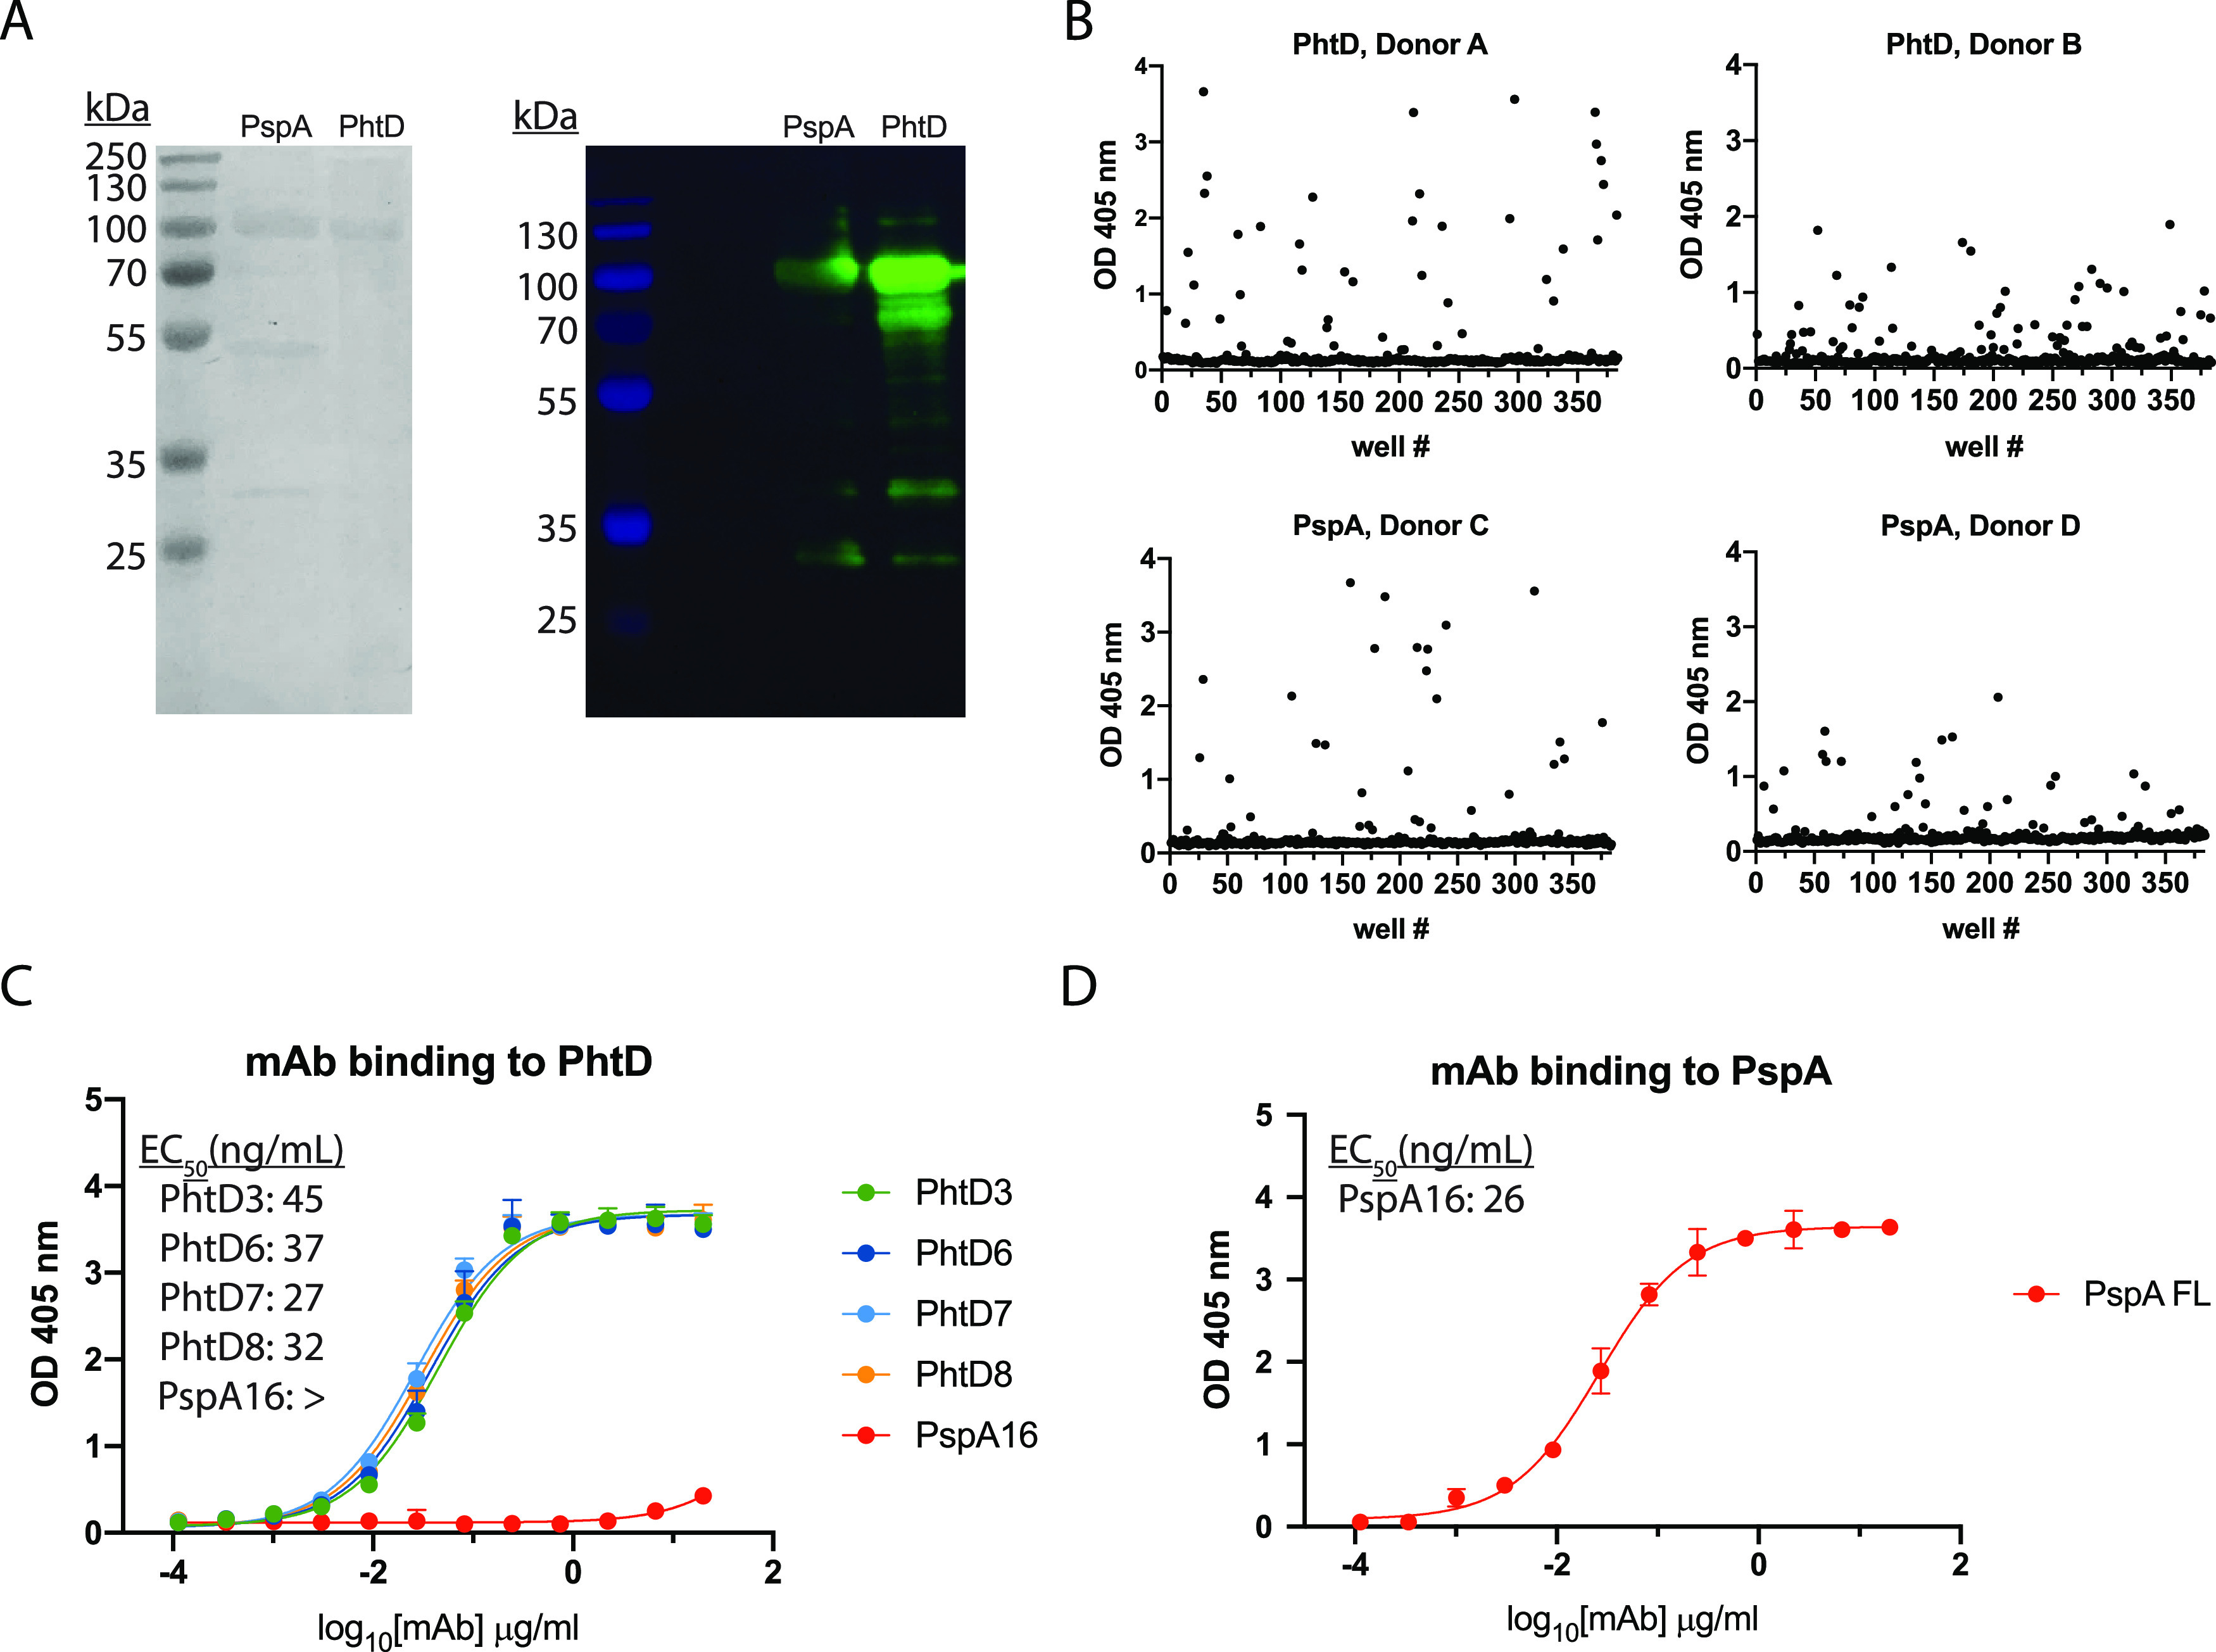
FIG 1.

Antibody responses and MAb binding properties to recombinant PhtD and PspA proteins. (A) SDS-PAGE (left) and Western blot (right) of purified recombinantly expressed PspA and PhtD. Both proteins were pure, with the appearance of degradation products. (B) ELISA binding responses from the supernatant of stimulated B cells to recombinant PhtD and PspA proteins. (C) ELISA binding curves of anti-PhtD MAbs against recombinant PhtD protein. PspA16 was utilized as a negative control. The symbol “>” indicates that no binding was observed at an OD405 greater than 1 at the highest concentration. (D) Binding of PspA16 to recombinant PspA. For panels C and D, computed EC50s are reported from a nonlinear regression curve fit (agonist). Data points are averages of four replicates from one of at least two independent experiments. Error bars indicate 95% confidence intervals.
