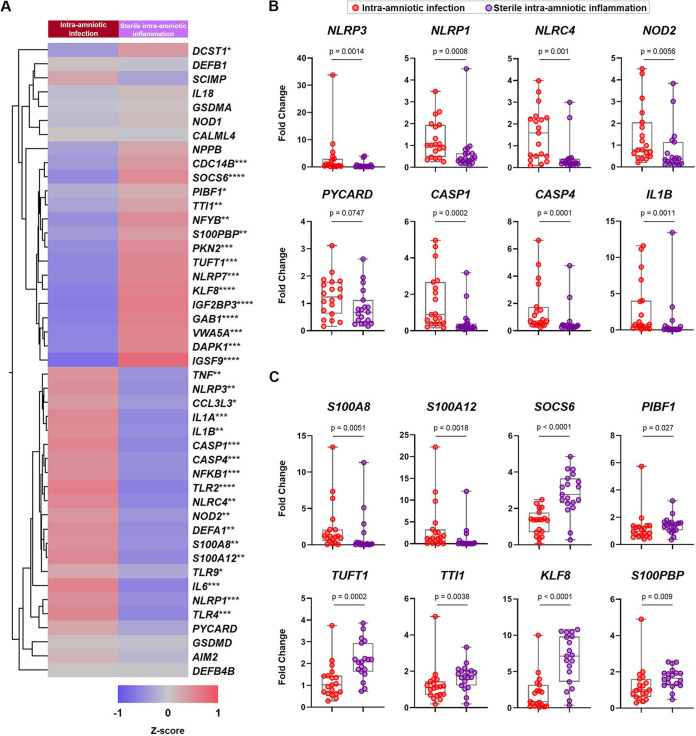
FIG 4.
qRT-PCR validation of expected and RNA seq-discovered genes in the chorioamniotic membranes from women with preterm labor and sterile intra-amniotic inflammation. (A) Heatmap representation showing the mean gene expression in the chorioamniotic membranes from women with intra-amniotic infection (n = 19) and those with sterile intra-amniotic inflammation (n = 19). Red indicates upregulation; blue indicates downregulation. Asterisks indicate significant differences between study groups: *, P < 0.05; **, P < 0.01; ***, P < 0.001; ****, P < 0.0001. (B) Fold changes in the expression of NLRP3, NLRP1, NLRC4, NOD2, PYCARD, CASP1, CASP4, and IL1B. (C) Fold changes in the expression of S100A8, S100A12, SOCS6, PIBF1, TUFT1, TTI1, KLF8, and S100PBP. Data are shown as box-and-whisker plots, where midlines indicate medians, boxes indicate interquartile ranges, and whiskers indicate minimum/maximum ranges. P values were obtained by using Mann-Whitney U-tests.

