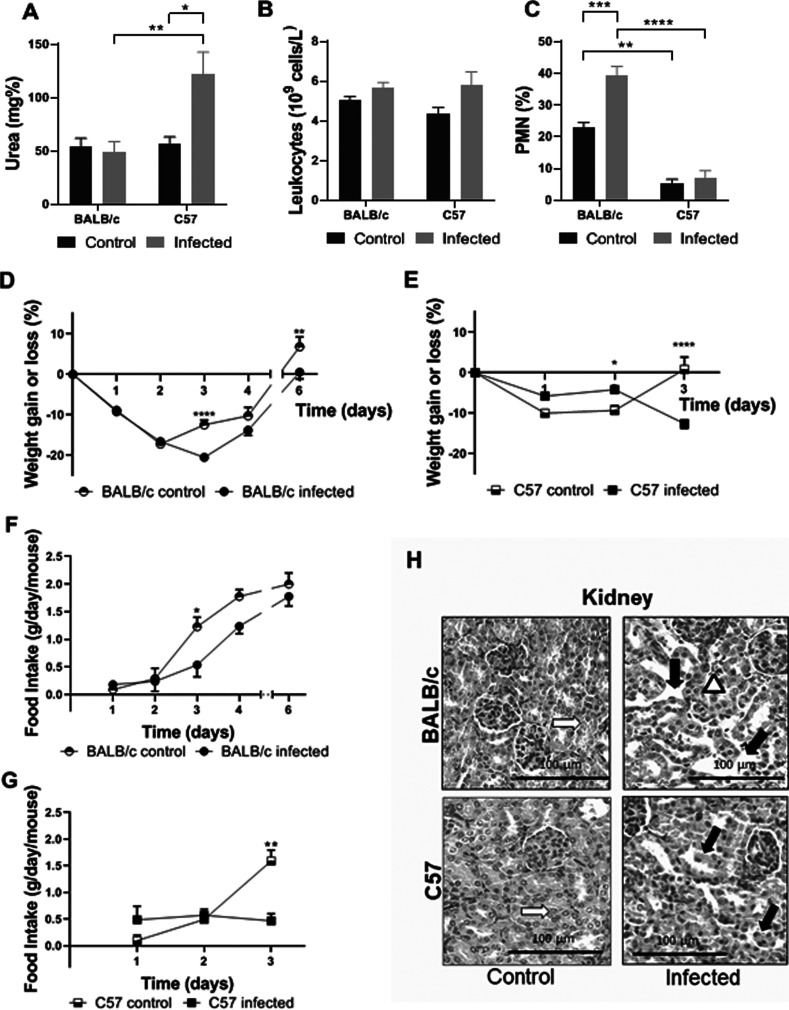
FIG 2.
Clinical, biochemical and histological studies during infection with O157:H7. BALB/c and C57 mice were infected with 2 to 3 × 10¹² CFU/kg of O157:H7. They were weighed daily and bled at day 3 p.i. The food intake was also recorded daily until the end of the experiments. Each bar or point represents the mean plus the standard error of the mean (mean ± SEM) of 5 mice for the control group and 9 mice for the infected group of each strain. Data from A to G were analyzed by two-way ANOVA test with Tukey’s posttest. (A) Plasma urea concentration. (B) Total leukocyte count. (C) Differential PMN count. (D) Percentage of weight gain or loss of BALB/c mice. (E) Percentage of weight gain or loss of C57 mice. (F) Food intake of BALB/c mice. (G) Food intake of C57 mice. *, P < 0.05; **, P < 0.01; ***, P < 0.001; ****, P < 0.0001. (H) Kidney histology. Representative images are shown. An infected BALB/c mouse presents vascular congestion in the cortex (white arrowhead) and tubular dilation (black arrows) compared to control. An image from an infected C57 mouse shows areas of tubular necrosis, with loss of epithelium and scaled cells into tubular lumen (black arrows). White arrows show normal tubules from control BALB/c and C57 mice.

