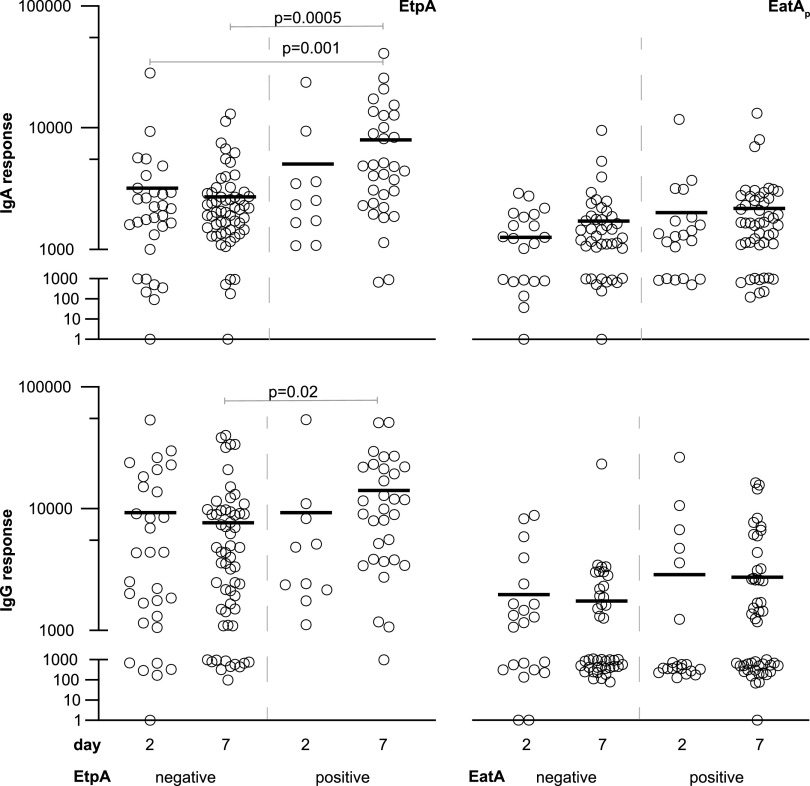
FIG 2.
ALS responses to EtpA or EatA. Shown are microarray data for IgA (top) and IgG responses to EtpA (left) and the passenger domain of EatA (EatAp) (right) on days 2 and 7 following hospitalization. Data in each graph are segregated according to antigen expression in the infecting strain (negative or positive). P values reflect Kruskal-Wallis values, with post hoc analysis using Dunn’s test adjusted for multiple comparisons for between-group analysis.

